Use PowerCenter workflow statistics to assess workflow instance performance, identify failed and long-running workflow runs, and troubleshoot issues.
Use filters to drill down on the data you want to view. The data displayed in each page is based on the combined filters you set.
Viewing PowerCenter workflow execution data
Use data collected on workflow run executions to gain insight into job run performance. You can view the overall performance of workflows for specified time ranges, for specific repositories and folders, by instance count, and by average time elapsed and data processed. You can also identify jobs with increasing failure rates or jobs with increasing run times.
1Click PowerCenter in the left hand navigation bar.
The PowerCenter dashboard page displays.
2Click a PowerCenter domain in the dashboard page.
3Click the Jobs tab.
A page displaying workflow runs displays.
4Use filters to select the workflow data to view. You can select additional columns to filter on from the Add Field menu.
The table page according to your filter settings.
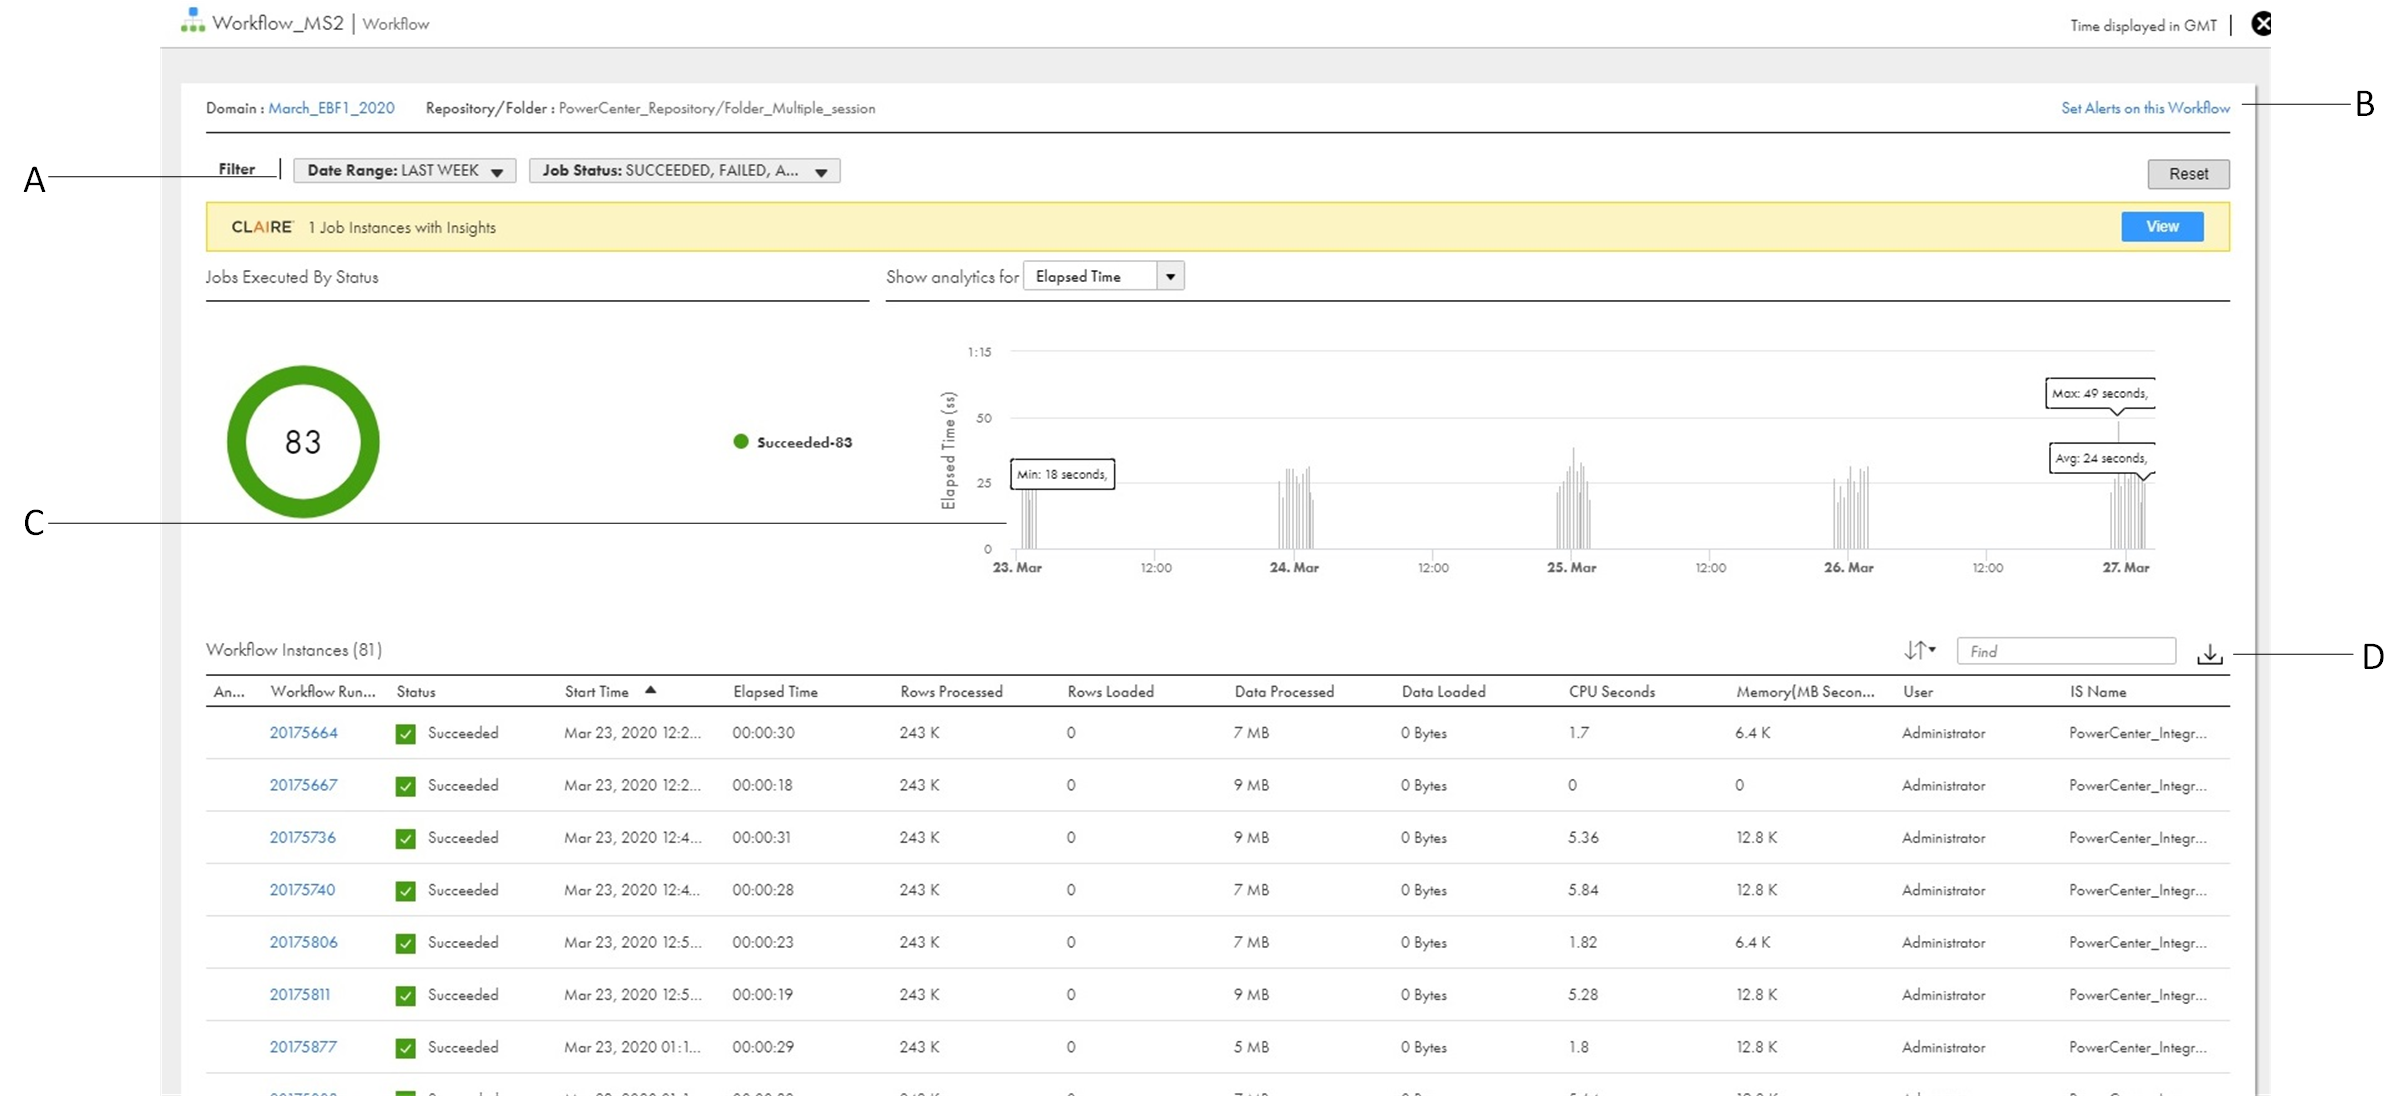
5Click a workflow in the table to view details on workflow instances.
A graph displaying job run statistics loads in the page. You can view statistics by elapsed run time, amount of data processed, the amount of data read from source rows read, and the amount of data written to target rows. The charts display data based on the filters you set.
A. Use filters to select the workflow data you want to view.
B. Configure alerts for the workflow.
C. Move your cursor across the graph to view specific details. You can zoom in on the graph to view details for a specific time frame. For more information, see Monitoring Informatica Intelligent Cloud Services.
D. Click the icon to download the Workflow Instances table data to a comma-separated value (.csv) file.
If anomalies are detected for workflow runs, you can view a list of the workflow instances that have anomalous behavior.
6 Click a Run ID in the Workflow Instances table to view task details.
Viewing anomalous workflow run behavior
Operational Insights leverages the CLAIRE engine, which employs statistical and machine learning approaches to detect data outliers and anomalies, to provide insights that notify you about abnormal PowerCenter workflow run behavior.
CLAIRE detects anomalies by analyzing elapsed run times, data processed and loaded, and rows processed and loaded for workflows each day. You can use this data to identify time periods during which anomalous or abnormal behavior occurred and determine the root cause.
1Click PowerCenter in the left hand navigation bar.
2Perform one of the following steps:
- Click the New Insights link in the panel for a domain.
- Click a PowerCenter domain in the dashboard page, and then click View in the panel indicating that workflows with insights have been detected.
The Jobs page opens with a list of the workflow instances that have anomalous behavior.
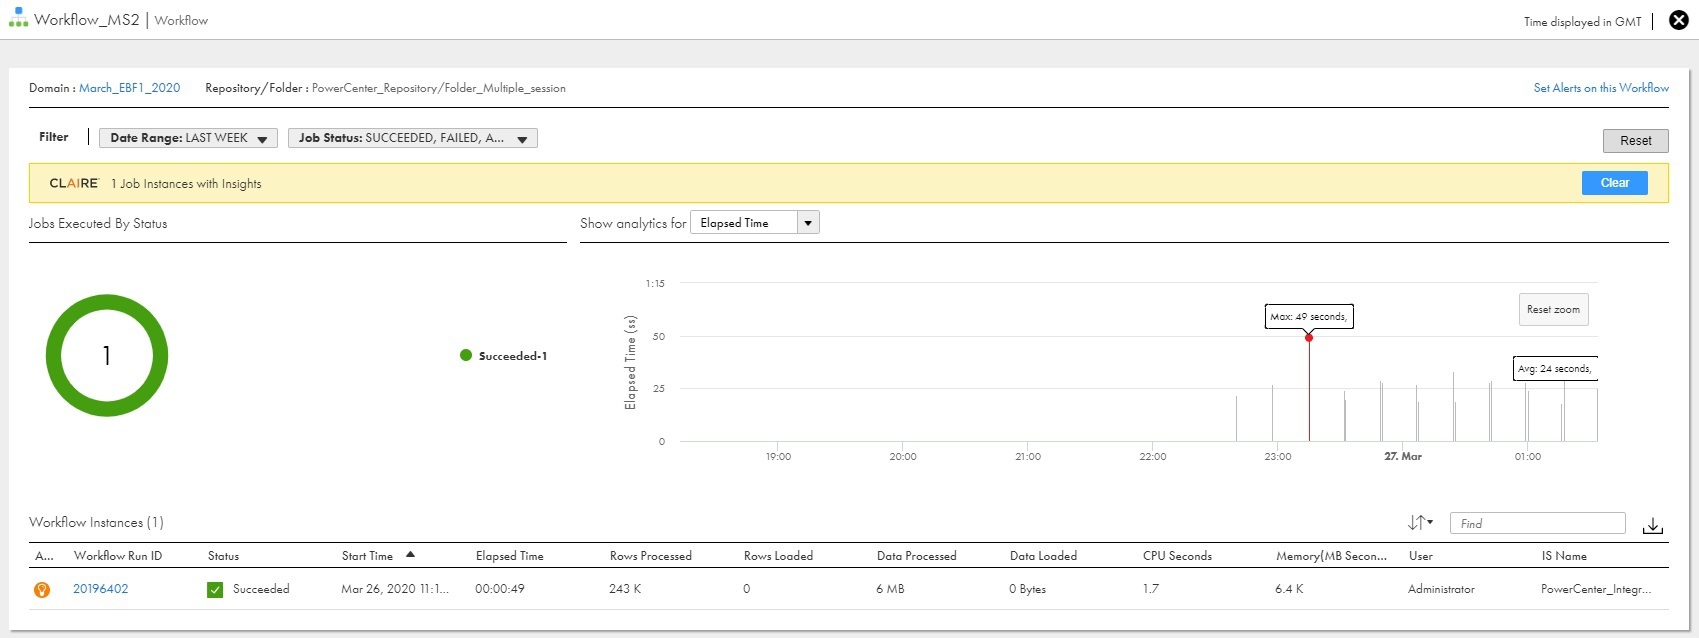
3Anomalous values are enclosed in red boxes. Click a value enclosed in a red box, and then click Show All Anomalies of this Job.
Click the tab above the graph for the metrics containing the anomalous run data, such as Data Processed.
The graph updates with data for the workflow instance. Bars in the graph correlating to anomalous behavior are indicated by a red dot.
4Click a red dot in the graph to view the details for the anomaly.