Process Developer Debug Perspective Views and Menus
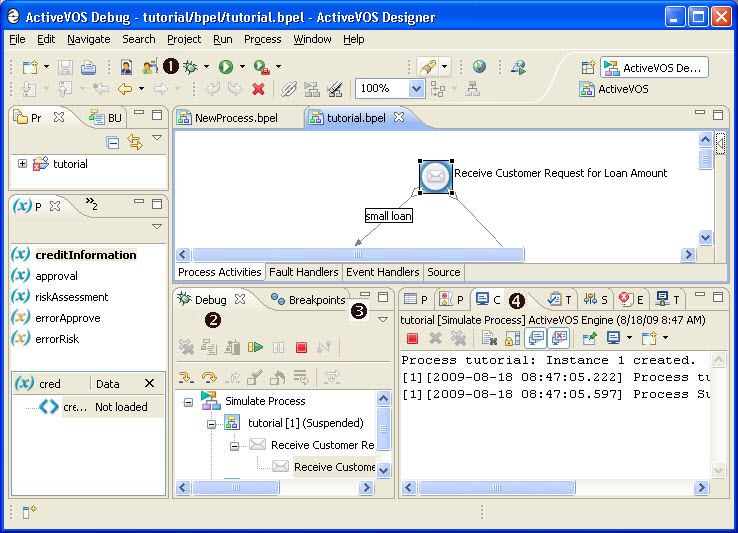
The following illustration shows the views and menus that make up the Debug perspective:
Using the Process Developer Debug View
The Process Developer Debug perspective contains a Debug view that lets you manage the running or stepping through of a BPEL process that you have created or imported into Process Developer. It displays an execution tree associated with the process you are debugging.
The Process Developer Debug view is based on the Eclipse Debug view, and not all functions apply to Process Developer. You will notice that some icons, options, and preferences are unavailable in Process Developer.
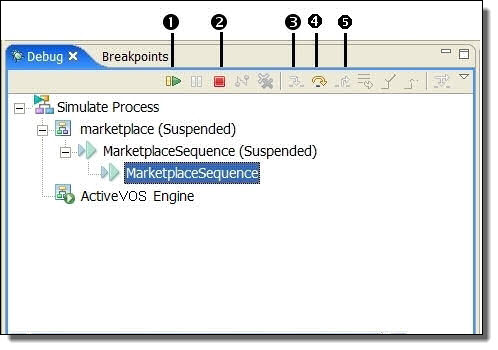
The following illustration shows a sample Debug view. The table describes function keys available.
1 | Resume (F8 key) | Resumes a suspended thread. Allow the process to run until the next breakpoint is encountered or until the process is completed. |
2 | Terminate | Terminates the selected debug target |
3 | Step Into (F5 Key) | The process executes until the next activity in the process is reached. If the activity is a container, such as a scope, if, while or for each, the execution of each activity in the container takes place. Tip: You can also step into an invoke activity that is a subprocess. For details, see Selecting an Invoke Subprocess for Simulation. |
4 | Step Over (F6 Key) | The process executes until the next activity in the process is reached. If a breakpoint is encountered, the execution suspends at the breakpoint. |
5 | Step Return (F7 Key) | Use this to return from a container that has been stepped into. Even though the step returns from the container, the remainder of the activities in the container are still executed. |
In addition to the toolbar options, there are more options on the right mouse menu of a simulation thread item. The following illustration shows only the additional options, not all the options available on the right mouse menu.
Copy Stack | Copies the selected stack of suspended threads as well as the state of the running threads to the clipboard |
Terminate and Remove | Terminates the selected debug target and removes it from the view |
Relaunch | Start a new simulation |
Terminate All | Terminates all active simulations in the view |
Using Breakpoints in BPEL Process Simulation
The Breakpoints view is part of the Process Developer Debug perspective. You can set a breakpoint on an activity and then run to the breakpoint when simulating or remotely debugging the process's execution.
The Breakpoints view is part of the Process Developer Debug perspective. You can set a breakpoint on an activity and then run to the breakpoint when simulating process execution.
The Breakpoints view lists all the breakpoints you have set in BPEL processes. You can double-click a breakpoint to display its location in the Process Editor. In the Breakpoints view, you can also enable, disable, skip, or remove breakpoints.
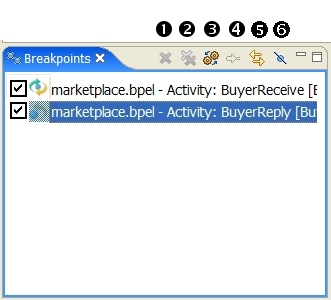
The following illustration shows a sample Breakpoints view and process. The breakpoints were added next to an activity, and the list of breakpoints appears in the Breakpoints view.
1 | Removes selected breakpoints |
2 | Removes all breakpoints for all targets |
3 | Shows breakpoints supported by selected target |
4 | Goes to file for breakpoint |
5 | Ties the view to always show the current file being debugged |
6 | Skips all breakpoints |
Adding a breakpoint:
- 1. From the Project Explorer, open a BPEL file.
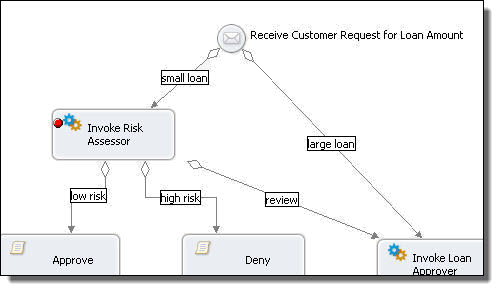
- 2. Right-mouse click on an activity where you want to set a breakpoint and select Add Breakpoint.
A red circle appears next to the activity to indicate the breakpoint, as shown.
Tips for working in the Breakpoints view
- •Select Remove All Breakpoints from the toolbar to delete all breakpoints displayed.
- •Double-click a breakpoint to highlight its location in the Process Editor.
- •Right-click a breakpoint and select Go to File to go to the activity in the Process Editor where the breakpoint is set. If the file is not already open, this option opens the file and finds the breakpoint.
- •Each breakpoint shows the name of the BPEL file and activity where the breakpoint is set. All breakpoints are listed for all files you are debugging.
- •You can Enable and Disable breakpoints by selecting/deselecting the check mark in the box next to the breakpoint. A disabled breakpoint appears as a grey circle next to an activity icon.
Using the Process Developer Debug Console
The Console view is part of the Process Developer Debug perspective.
This view shows execution events and provides a view into the evaluation of expressions and results.
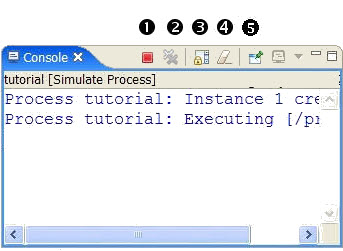
The following illustration shows a sample of the Console.
1 | Terminate. Stops the current simulation |
2 | Removes all terminated launches |
3 | Scroll Lock. Automatically wraps long lines to avoid horizontal scrolling. |
4 | Clears console |
5 | Pin Console. Not applicable. |
As your process executes, the following types of events are displayed:
Activity type, name, and path | Executing, completed normally, or completed with a fault Example: Receive:Executing </process/flow/receive> |
Link name, link transition condition, and path | Status and evaluation of expression Example: Link receive-to-assess Condition true : bpws:getVariableData('request','amount') < 10000 </process/flow/links/link[@name='receive-to-assess']> |
On Alarm | Duration or deadline |
Wait | Wait value and simulated Wait value |
Join Condition | Evaluation of expression |
While, If, Repeat Until Condition | Evaluation of expression |
Unhandled events | Ancillary event information |
Tips for using the Console:
- •Use the right-mouse menu to go to an activity that has already executed.
- •Use the right-mouse menu to find a simulation event in the Console.