Diagnosing and tuning poorly performing Oracle queries
This is a big topic, but we'll focus in on what a bad query plan looks like, what a good query plan looks like, and one example of how to improve a poor performing query. There is no generic way to tune all poorly performing queries, but hopefully this page can educate you on the tools you need to identify and diagnose a poor performing query and an example of how this particular query was tuned. The first part of this how-to is PIM specific, but the important parts are only specific to Oracle.
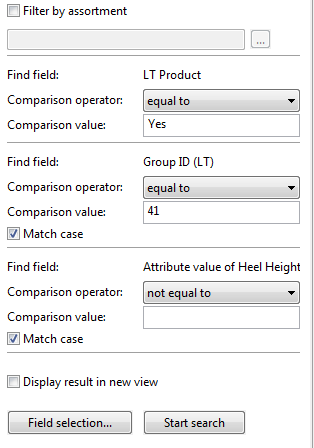
The first step is to find the poor performing query. In our example, a PIM Desktop user issued a query and noticed poor performance:
The first step is to go through the logs to try to find the query. As PIM uses hibernate, the following categories (org.hibernate.SQL and org.hibernate.type.descriptor.sql.BasicBinder) had to be updated to TRACE in the log4j.xml file to enable logging of SQLs as well as bind parameters:
<!-- Use "TRACE" to see the debug output from UDA and activate tracing in stored procedures. Check also server.properties property "db.default.debug.show_sql" --><category name="UDA" additivity="false"> <priority value="TRACE"/> <appender-ref ref="UdaAppender"/></category> <!-- Use "TRACE" to see the debug output from Hibernate org.hibernate.cache Log all second-level cache activity org.hibernate.hql.ast.AST Log HQL and SQL ASTs during query parsing org.hibernate.jdbc Log all JDBC resource acquisition org.hibernate.pretty Log the state of all entities (max 20 entities) associated with the session at flush time org.hibernate.SQL Log all SQL DML statements as they are executed (include org.hibernate.type to see binds and values) org.hibernate.secure Log all JAAS authorization requests org.hibernate.tool.hbm2ddl Log all SQL DDL statements as they are executed org.hibernate.transaction Log transaction related activity org.hibernate.type Log all JDBC parameters org.hibernate Log everything --><category name="org.hibernate.SQL" additivity="false"> <level value="TRACE" /> <appender-ref ref="UdaAppender"/></category><category name="org.hibernate.type.descriptor.sql.BasicBinder" additivity="false"> <level value="TRACE" /> <appender-ref ref="UdaAppender"/></category>Changes in this file do not require a server restart, and after the above query is executed again, you will need to find the query in the logs.
Here's the query after we've replaced the necessary bind parameters:
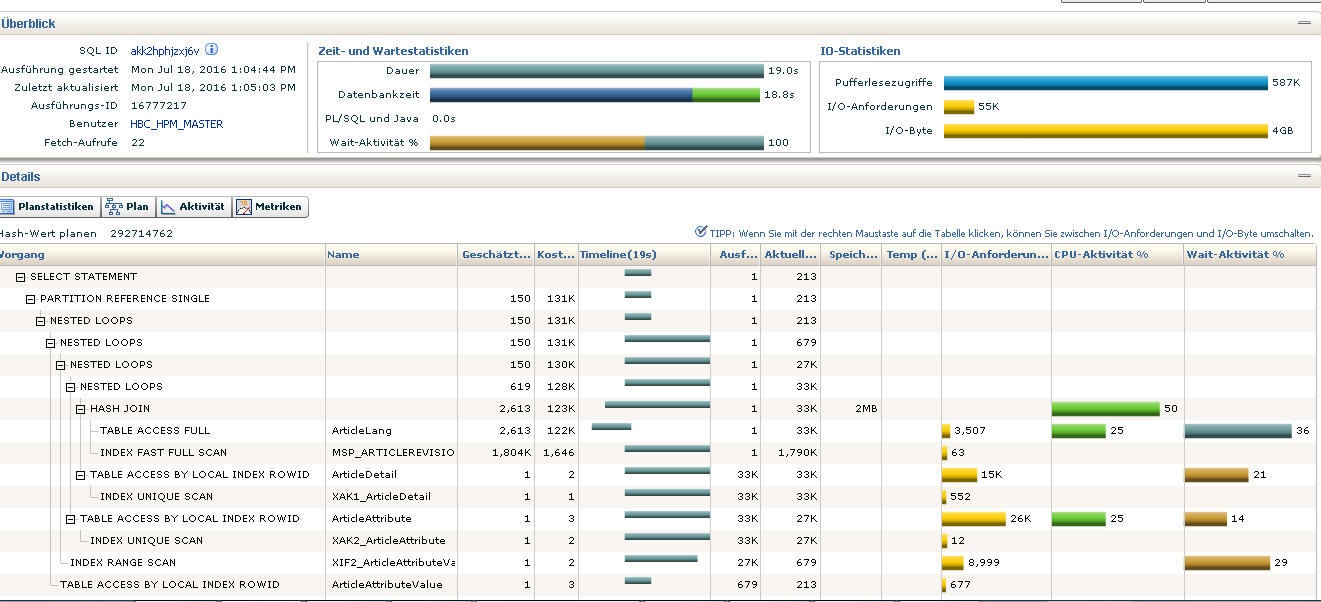
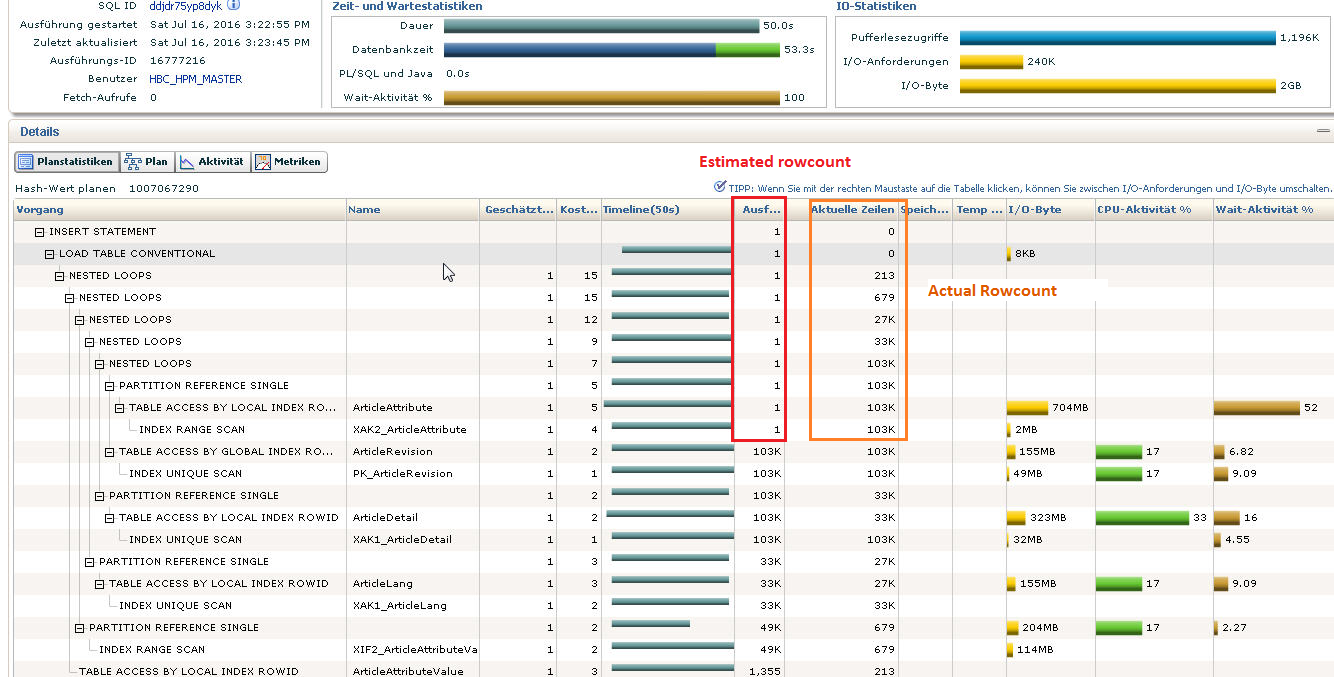
set linesize 1000 explain plan forselect articlerev0_."ID", articlerev0_."Identifier" from "ArticleRevision" partition(P_PRODUCT) articlerev0_ left outer join "ArticleDetail" partition(P_PRODUCT) articledet1_ on articlerev0_."ID"=articledet1_."ArticleRevisionID" and articledet1_."DeletionTimestamp" = TO_TIMESTAMP('9999-12-31','yyyy-mm-dd') left outer join "ArticleLang" partition(P_PRODUCT) articlelan2_ on articlerev0_."ID"=articlelan2_."ArticleRevisionID" and ( articlelan2_."LanguageID"=9 and articlelan2_."Res_LK_Text100_01"='LT' and articlelan2_."Res_LK_Int_01"=0 and articlelan2_."ChannelID"=1 and articlelan2_."EntityID"=21007 ) and articlelan2_."DeletionTimestamp" = TO_TIMESTAMP('9999-12-31','yyyy-mm-dd') left outer join "ArticleAttribute" partition(P_PRODUCT) articleatt3_ on articlerev0_."ID"=articleatt3_."ArticleRevisionID" and ( articleatt3_."NameInKeyLanguage"='Heel Type' ) and articleatt3_."DeletionTimestamp" = TO_TIMESTAMP('9999-12-31','yyyy-mm-dd') left outer join "ArticleAttributeValue" partition(P_PRODUCT) articleatt4_ on articleatt3_."ID"=articleatt4_."ArticleAttributeID" and ( articleatt4_."Identifier"='ALL' and articleatt4_."LanguageID"=9 ) and articleatt4_."DeletionTimestamp" = TO_TIMESTAMP('9999-12-31','yyyy-mm-dd') where articlerev0_."RevisionID" = 1 and articlerev0_."DeletionTimestamp" = TO_TIMESTAMP('9999-12-31','yyyy-mm-dd') and articledet1_."Res_Bit_02"=1 and articlelan2_."Res_Text250_05"='41' and ( articleatt4_."Value" is not null ) and articlerev0_."EntityID"=1100;Explaining the plan query for this resulted in the following. Notice the difference between the estimated row count and the actual row count? This results in Oracle choosing an incorrect plan with an incorrect join order and many nested loops.
Also notice that an INDEX RANGE SCAN was performed on index XAK2_ArticleAttribute in table ArticleAttribute, which resulted in an incorrect estimated row count.
To investigate further, a 10053 Optimizer trace is needed. In the same session from where you issued the query and explain plan, do the following. Pay attention to the commented lines below. You'll need to turn on tracing, execute the query, then turn off tracing. Then you'll need to view the trace files, preferably with a utility:
-- activate generating trace filesALTER SESSION SET EVENTS='10053 trace name context forever, level 1';-- deactive generating trace filesALTER SESSION SET EVENTS '10053 trace name context off';-- get filenames for trace sessionselect u_dump.value || '/' || instance.value || '_ora_' || v$process.spid|| nvl2(v$process.traceid, '_' || v$process.traceid, null ) || '.trc'"Trace File"from V$PARAMETER u_dumpcross join V$PARAMETER instancecross join V$PROCESSjoin V$SESSION on v$process.addr = V$SESSION.paddrwhere u_dump.name = 'user_dump_dest'and instance.name = 'instance_name'and V$SESSION.audsid=sys_context('userenv','sessionid');Navigate to the Explain Plan section of the trace file to confirm you are looking at the proper query in the trace file:
----- Explain Plan Dump ---------- Plan Table ----- ============Plan Table============---------------------------------------------------------------------------+-----------------------------------+---------------+| Id | Operation | Name | Rows | Bytes | Cost | Time | Pstart| Pstop |---------------------------------------------------------------------------+-----------------------------------+---------------+| 0 | SELECT STATEMENT | | | | 10 | | | || 1 | NESTED LOOPS | | 1 | 116 | 10 | 00:00:01 | | || 2 | NESTED LOOPS | | 1 | 116 | 10 | 00:00:01 | | || 3 | NESTED LOOPS | | 1 | 84 | 7 | 00:00:01 | | || 4 | PARTITION REFERENCE SINGLE | | 1 | 55 | 5 | 00:00:01 | KEY(AP)| KEY(AP)|| 5 | TABLE ACCESS BY LOCAL INDEX ROWID | ArticleAttribute | 1 | 55 | 5 | 00:00:01 | 2 | 2 || 6 | INDEX RANGE SCAN | XAK2_ArticleAttribute | 1 | | 4 | 00:00:01 | 2 | 2 || 7 | TABLE ACCESS BY GLOBAL INDEX ROWID | ArticleRevision | 1 | 29 | 2 | 00:00:01 | 2 | 2 || 8 | INDEX UNIQUE SCAN | PK_ArticleRevision | 1 | | 1 | 00:00:01 | | || 9 | PARTITION REFERENCE SINGLE | | 1 | | 2 | 00:00:01 | KEY(AP)| KEY(AP)|| 10 | INDEX UNIQUE SCAN | XAK1_ArticleAttributeValue| 1 | | 2 | 00:00:01 | KEY(AP)| KEY(AP)|| 11 | TABLE ACCESS BY LOCAL INDEX ROWID | ArticleAttributeValue | 1 | 32 | 3 | 00:00:01 | 1 | 1 |---------------------------------------------------------------------------+-----------------------------------+---------------+In my trace file the explain plan dump for the query starts at line 6613.
Using a trace file viewer is recommended - general steps to find the issue are:
Find the proper 'optimizing query block' (OPTIMIZING QB) section for your sql (If using v10053.exe look for the OPTIMIZING QB section on the left hand side).
Look for the Access path analysis for the table containing the wrong statistic (ArticleAttribute in our case).
Look for the column containing the index giving the wrong estimated row count. In our case, the XAK2_ArticleAttribute index is on the NameInKeyLanguage column.
At this point you'll want to familiarize yourself with how Oracle uses histograms to manage statistics.
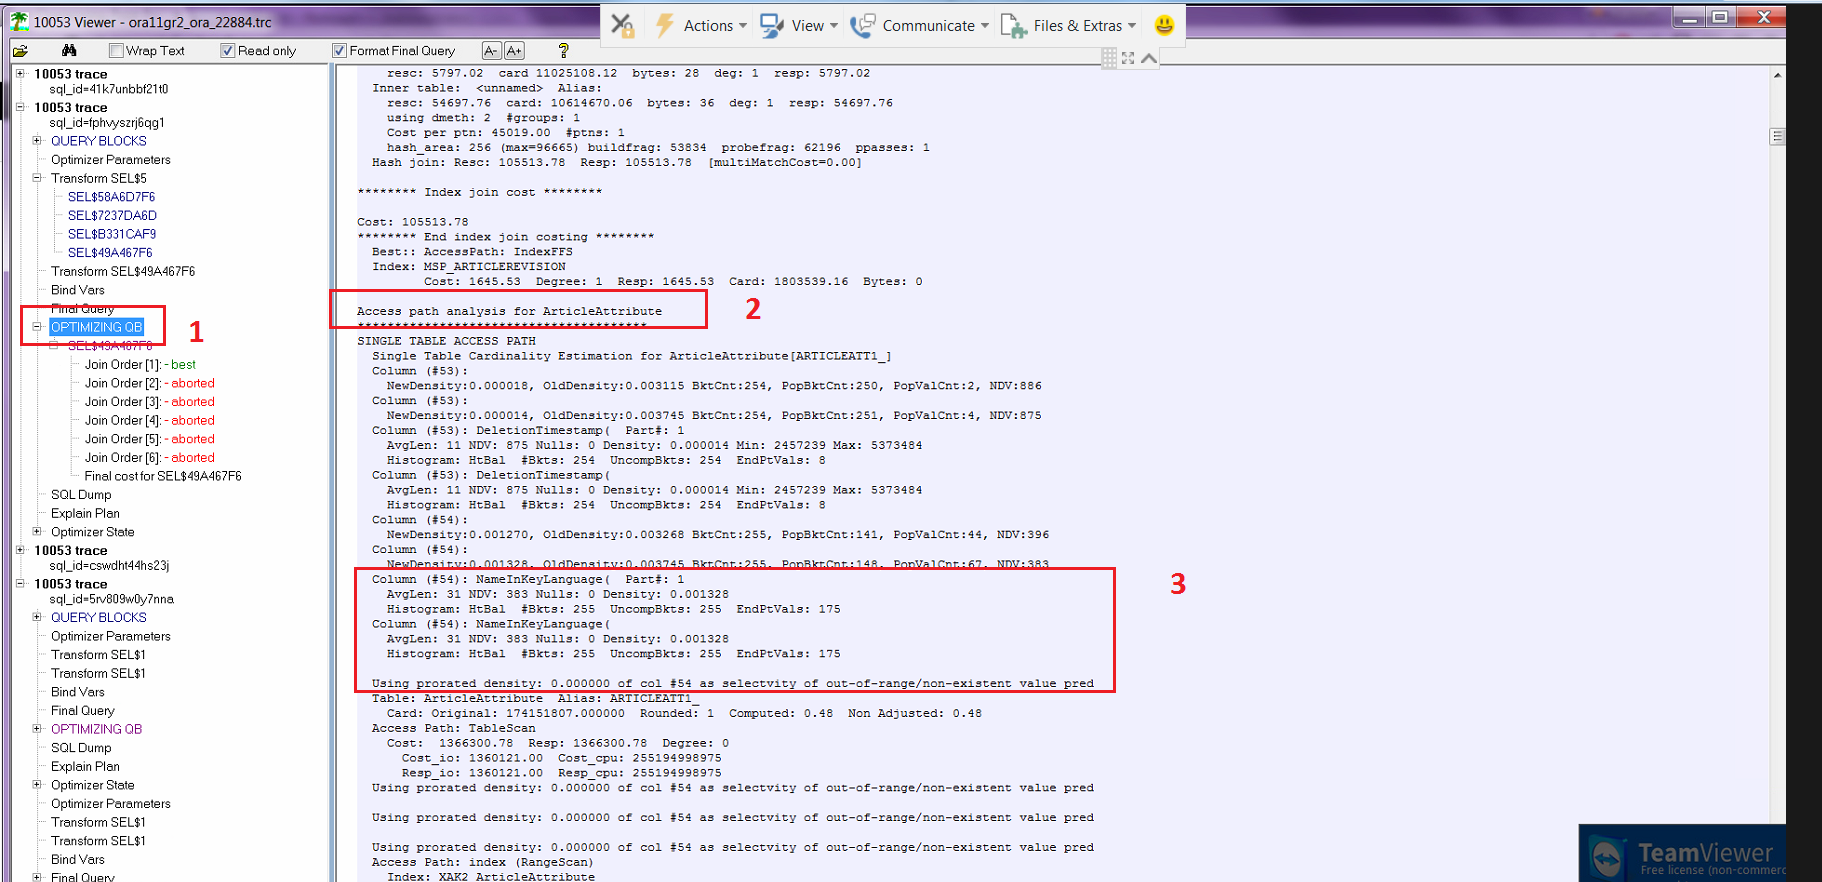
If you look closely at section 3, you'll notice that the NDV (Number of Distinct Values) is 383, but the #Bkts (Buckets) is 255 from the HtBal (Height Balanced) histogram. The NameInKeyLanguage value of 'Heel Height' was unfortunately not in one of the buckets, which causes the "Using prorated density: 0.000000 of col #54 as selectvity of out-of-range/non-existent value pred" message you see. This causes the optimizer to incorrectly guess that this value doesn't exist in this table and that joining to this table would also return no rows for the query (prorated density of 0).
To fix this, we need to delete the histogram. Here's a script which deletes all histograms for all varchars with > 254 distinct values, as the number of buckets isn't sufficient to cover all values so a height balanced histogram isn't desired for this scenario (in general, height balanced histograms are almost useless for varchar2 columns).
-- script which deletes all height balanced histograms for nvarchar2 columns with more than 254 distinct valuesBEGIN FOR COL_ITEM IN ( SELECT stats.OWNER, stats.TABLE_NAME, stats.COLUMN_NAME FROM DBA_TAB_COL_STATISTICS stats INNER JOIN DBA_TAB_COLUMNS cols ON stats.TABLE_NAME = cols.TABLE_NAME AND stats.COLUMN_NAME = cols.COLUMN_NAME WHERE cols.DATA_TYPE = 'NVARCHAR2' AND stats.HISTOGRAM <> 'NONE' AND stats.NUM_DISTINCT > 254 AND stats.OWNER = cols.OWNER AND stats.OWNER IN ('HBC_HPM_MAIN','HBC_HPM_MASTER','HBC_HPM_SUPPLIER') ORDER BY stats.OWNER, stats.TABLE_NAME, stats.COLUMN_NAME ) LOOP DBMS_STATS.DELETE_COLUMN_STATS (OWNNAME=>COL_ITEM.OWNER, TABNAME=>'"' || COL_ITEM.TABLE_NAME || '"', COLNAME=>'"' || COL_ITEM.COLUMN_NAME || '"', COL_STAT_TYPE=>'HISTOGRAM'); END LOOP;END;/Finally, to prevent Oracle's automatic statistics job from regenerating the histogram you need to call the set_table_prefs function.
Pass size 1 as the METHOD_OPT to prevent histogram creation:
--This does not work as column and table name are lowercase and must be passed with double quote.--TODO is to fix this call to work with mixed case table and column namesBEGIN DBMS_STATS.set_table_prefs('HBC_HPM_MASTER', '"ArticleAttribute"','METHOD_OPT', 'for all columns size skewonly for columns size 1 "NameInKeyLanguage"');END;/After fixing this and a similar issue in the Res_Text250_05 column for table ArticleLang, we get the following plan. While the actual and estimated row counts are off, the join order is now more efficient (Good: ArticleLang, ArticleDetail, ArticleAttribute, ArticleAttributeValue vs. Bad: ArticleAttribute, ArticleDetail, ArticleLang, ArticleAttributeValue previously). For outer joins In general, the most limiting tables should be joined first, which for PIM means ArticleAttribute and ArticleAttributeValue should usually be joined last as they are larger than the Article table by some factor.