Database Operation
Database update
Prerequisites on Oracle
In case the Product 360 database is running in archive log mode (most likely), make sure to turn archive log mode off before executing the database update setup.
Otherwise you might risk exceeding available archive log disk space, in which case any database activity will be suspended immediately, and it will stay suspended until there is free available disk space again.
Maintenance tasks
Indices and Statistics
The database uses indices to increase the performance for read access on columns. In Product 360 we have indices on the columns which are typically used for selecting data, for example, all logical keys are at least part of an index. Additionally to that, the database uses statistics about the data in the tables in order to choose the most effective execution plan. Indices as well as statistics need to me maintained by the database administrator on a regular basis. Usually this is being done by creating a Maintenance Task which executes every day.
However, the typical maintenance task is more something of a bulldozer in maintaining. This means, it just rebuilds or reorganizes all indices no matter if needed or not and it also kills all statistics and rebuilds them no matter if needed or good for the statistic. Sometimes statistics which are very accurate get blindly rebuild and the result is a statistic which is not that accurate anymore, leading to a lesser performance than what you could have.
So, the general recommendation (from Microsoft Consulting) is like this (pseudo code):
if (number of pages in index < 1000)
do nothing
else
if (fragmentation < 5%)
do nothing
else if (fragmentation between 5% and < 30%)
reorganize index + update its statistics
else
rebuild index
Additionally to that you should update statistics for all non-indexed columns and monitor index fragmentation to adjust the fill factor.
Create Maintenance Plan for SQL Server
All these steps can be combined in a single, easy to execute stored procedure which has generously been provided by Ola Hallengren. For a detailed description about the index and statistic maintenance script please refer to the online description which is available here:
http://ola.hallengren.com/sql-server-index-and-statistics-maintenance.html. It will create all necessary objects for you. (For you convenience we attached the script it also to this wiki page)
Automatic execution (MSSQL2012)
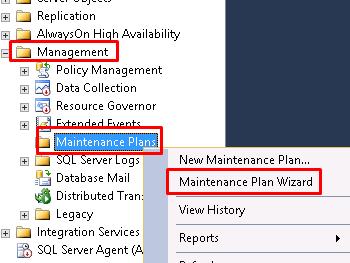
Execute the MaintenanceSolution.sql script on your database. Be sure that your SQL Server Agent (service) is running.
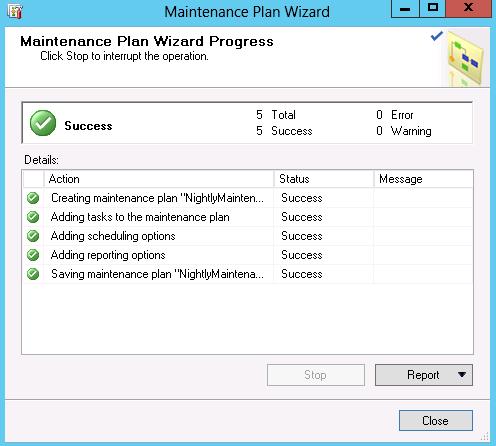
Create new Maintenance Plan by using the Maintenance Plans Wizard as shown below
In case you get following error: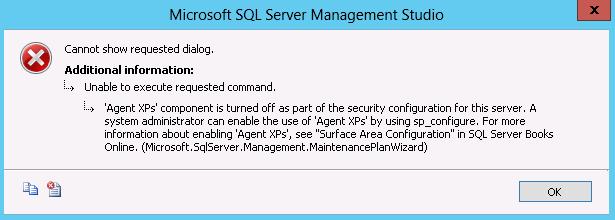
execute this statement:sp_configure'show advanced options', 1;GORECONFIGURE;GOsp_configure'Agent XPs', 1;GORECONFIGUREGOType the name of your new maintenance plan and configure your job schedule, then click on Next
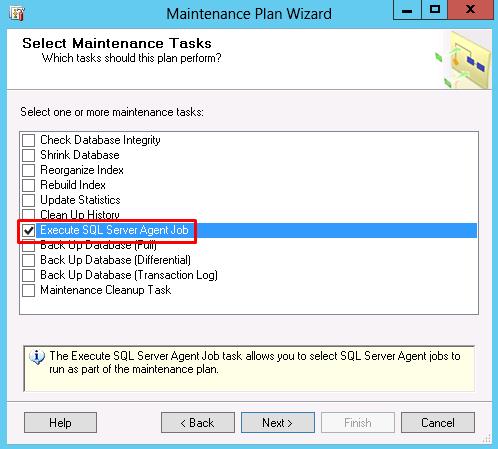
Select the Execute SQL Server Agent Job and click on Next twice
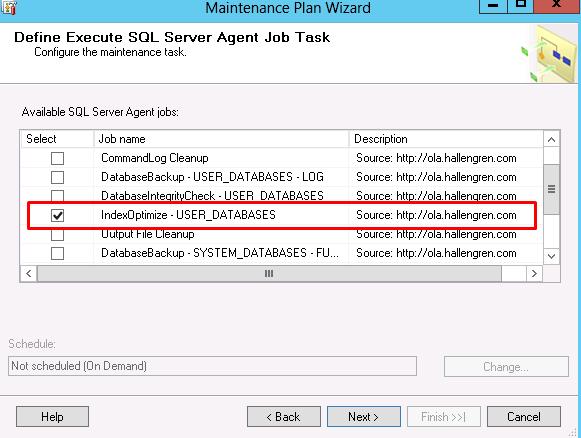
Choose IdexOptimize and click on Next
(Optional) Configure the report location and click on Next
After clicking Finish the task will check for any warnings or errors:
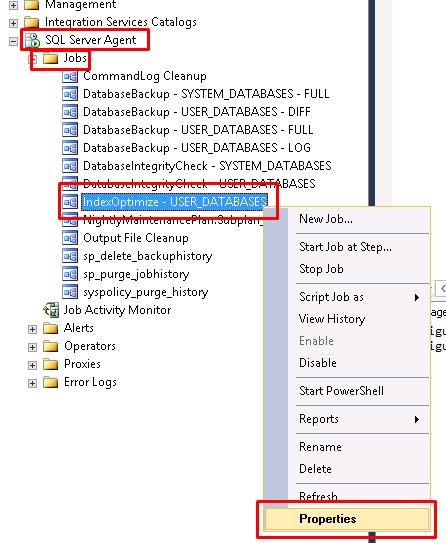
Click on the SQL Server Agent node from the left-hand side to expand the menu and open the Jobs node. T hen right-click on IndexOptimze and go to the Properties view as shown below:
Click on Steps, then Edit and a new Dialog will popup.
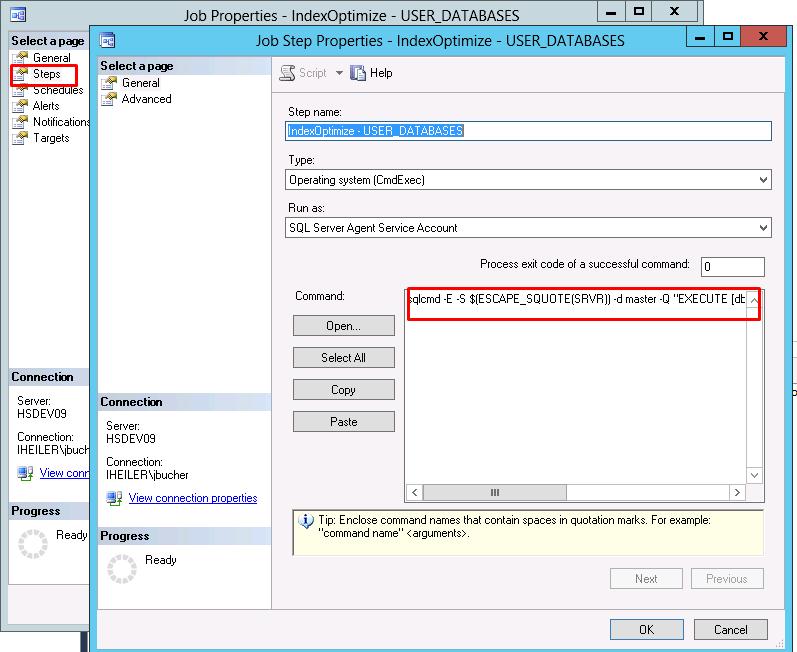
Modify the command statement (in this example the job will be executed on all user databases)
sqlcmd -E -S $(ESCAPE_SQUOTE(SRVR)) -d master -Q"EXECUTE [dbo].[IndexOptimize] @Databases = 'USER_DATABASES', @FragmentationLow = NULL, @FragmentationMedium = 'INDEX_REORGANIZE,INDEX_REBUILD_ONLINE,INDEX_REBUILD_OFFLINE', @FragmentationHigh = 'INDEX_REBUILD_ONLINE,INDEX_REBUILD_OFFLINE', @FragmentationLevel1 = 5, @FragmentationLevel2 = 30, @UpdateStatistics = 'COLUMNS', @OnlyModifiedStatistics = 'Y', @LogToTable = 'Y'"-bMake sure to reformat above statement to a valid format.
Click OK
Schedule the job in the Properties view
Manual execution
Download and execute the MaintenanceSolution.sql script.
Execute following SQL statement (in this example the index will get optimized on PIM_MAIN, PIM_MASTER and PIM_SUPPLIER)
SQL Statement to executeEXECUTEdbo.IndexOptimize @Databases ='PIM_MAIN, PIM_MASTER, PIM_SUPPLIER', @FragmentationLow =NULL, @FragmentationMedium ='INDEX_REORGANIZE,INDEX_REBUILD_ONLINE,INDEX_REBUILD_OFFLINE', @FragmentationHigh ='INDEX_REBUILD_ONLINE,INDEX_REBUILD_OFFLINE', @FragmentationLevel1 = 5, @FragmentationLevel2 = 30, @UpdateStatistics ='COLUMNS', @OnlyModifiedStatistics ='Y'Make sure to reformat above statement to a valid format.
Create Maintenance Plan for Oracle
If the Oracle database instance is fully dedicated to PIM, it is recommended to disable the system job which creates plan directives because these directives can cause performance issues.
BEGIN DBMS_AUTO_TASK_ADMIN.DISABLE ( CLIENT_NAME => 'sql tuning advisor', OPERATION => NULL, WINDOW_NAME => NULL );END;/If the Oracle database instance is fully dedicated to PIM, it is recommended to disable the system job which automatically updates statistics on a daily basis because it does not create histograms:
BEGIN DBMS_AUTO_TASK_ADMIN.DISABLE ( CLIENT_NAME => 'auto optimizer stats collection', OPERATION => NULL, WINDOW_NAME => NULL );END;/Instead, the DBA should create its own job for statistics maintenance. It should be executed on a periodic basis, recommended nightly but also ad-hoc after more than 20% of the data has been significantly changed (e.g. during a large import).
Here is an example script which covers default Product 360 installations, the DBA is encouraged to adjust it accordingly to the specific Product 360 environment:
--*******************************************************************************************-- Statistics collection with SKEWONLY-- * Automatically creates histograms on any column that shows a skew in data distribution-- * Despite time consumption it is always recommended to use ESTIMATE_PERCENT = 100--*******************************************************************************************BEGIN DBMS_STATS.GATHER_SCHEMA_STATS( OWNNAME => 'PIM_MAIN', OPTIONS => 'gather', ESTIMATE_PERCENT => 100, METHOD_OPT => 'for all columns size skewonly', CASCADE => true, DEGREE => 8 ); DBMS_STATS.GATHER_SCHEMA_STATS( OWNNAME => 'PIM_MASTER', OPTIONS => 'gather', ESTIMATE_PERCENT => 100, METHOD_OPT => 'for all columns size skewonly', CASCADE => true, DEGREE => 8 ); DBMS_STATS.GATHER_SCHEMA_STATS( OWNNAME => 'PIM_SUPPLIER', OPTIONS => 'gather', ESTIMATE_PERCENT => 100, METHOD_OPT => 'for all columns size skewonly', CASCADE => true, DEGREE => 8 ); END;/Height-Balanced Histograms on NVARCHAR2 Columns
In case there are more than 254 distinct values, Oracle can't use a frequency histogram anymore but switches to a height-balanaced histogram instead.
There are known performance issues with height-balanced histograms on NVARCHAR2 columns and it is recommended to delete all of these height-balanced histograms (otherwise the optimizer might create bad execution plans due to unpopular / non-existent value choices).
SET SERVEROUTPUT ONBEGIN FOR COL_ITEM IN ( SELECT stats.OWNER, stats.TABLE_NAME, stats.COLUMN_NAME FROM DBA_TAB_COL_STATISTICS stats INNER JOIN DBA_TAB_COLUMNS cols ON stats.TABLE_NAME = cols.TABLE_NAME AND stats.COLUMN_NAME = cols.COLUMN_NAME WHERE cols.DATA_TYPE = 'NVARCHAR2' AND stats.HISTOGRAM <> 'NONE' AND stats.NUM_DISTINCT > 254 AND stats.OWNER = cols.OWNER AND stats.OWNER IN ('PIM_MAIN','PIM_MASTER','PIM_SUPPLIER') ORDER BY stats.OWNER, stats.TABLE_NAME, stats.COLUMN_NAME ) LOOP DBMS_OUTPUT.PUT_LINE( 'Deleting height-balanced histogram for: "' || COL_ITEM.OWNER || '"."' || COL_ITEM.TABLE_NAME || '"."' || COL_ITEM.COLUMN_NAME || '"' ); DBMS_STATS.DELETE_COLUMN_STATS (OWNNAME=>COL_ITEM.OWNER, TABNAME=>'"' || COL_ITEM.TABLE_NAME || '"', COLNAME=>'"' || COL_ITEM.COLUMN_NAME || '"', COL_STAT_TYPE=>'HISTOGRAM'); END LOOP;END;/Extended Column Statistics
In case you are running Oracle 12.1 be aware of the "extended column statistics" feature. We strongly recommend turning off this feature, and to make sure that there aren't any extended statistics columns in all PIM schemas.
The following script can be used to delete system generated extended statistics:
SET SERVEROUTPUT ONBEGIN FOR c IN ( SELECT OWNER, TABLE_NAME, DBMS_LOB.SUBSTR(EXTENSION, 3000) X FROM DBA_STAT_EXTENSIONS WHERE OWNER LIKE 'PIM_%' AND CREATOR = 'SYSTEM' AND DROPPABLE = 'YES' ORDER BY TABLE_NAME, X ) LOOP DBMS_OUTPUT.PUT_LINE('Deleting system generated column stats for "' || c.OWNER || '"."' || c.TABLE_NAME || '" : ' || c.X); DBMS_STATS.DROP_EXTENDED_STATS(c.OWNER, '"' || c.TABLE_NAME || '"', c.X ); END LOOP;END;/It is recommended to disable the extended column statistics feature.
ALTER SYSTEM SET "_optimizer_enable_extended_stats"=FALSE SCOPE=BOTH;If they can't be disabled entirely, the following script can be used to disable extended column statistics only for all PIM schemas (possible starting with 12.2):
BEGIN FOR TABLE_ITEM IN ( SELECT t.OWNER, t.TABLE_NAME FROM DBA_TABLES t WHERE t.OWNER IN ('PIM_MAIN','PIM_MASTER','PIM_SUPPLIER') ORDER BY t.OWNER, t.TABLE_NAME ) LOOP DBMS_STATS.SET_TABLE_PREFS(TABLE_ITEM.OWNER, '"' || TABLE_ITEM.TABLE_NAME || '"', 'AUTO_STAT_EXTENSIONS', 'OFF'); END LOOP;END;/Backup and Recovery
Usually the backup and recovery strategy is defined by the customers IT department and it's dba. Product 360 core works fine with nightly backups using the "simple" recovery mode of the database, as well as transaction log backups during the day using the "full" recovery mode. Choose whatever your customer required in order to feel safe.
If you switch the schemas to recovery mode "full" you have to set up the transaction log backups. If you don't your transaction logs will keep on growing eventually without limits!
The backup plan should include the MASTER, SUPPLIER and MAIN schemas as well as all the runtime folders like import, export where the import and export files are stored.
Tuning
MS-SQL Server
Activity Monitor
Use the Activity Monitor which is available in SQL Server to quickly identify slow statements and connection problems. Please see this knowledge base article which explains how to open the activity monitor, as well as this blog entry which gives a brief overview on what the activity monitor can do for you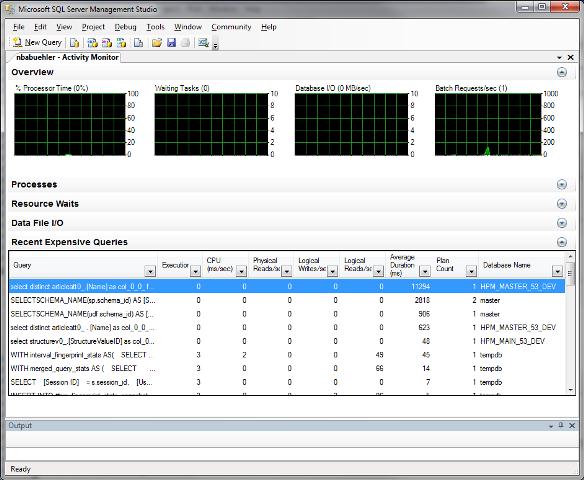
Data Collection
The activity monitor is a quite effective tool to get an overview of the current load on the database. However, sometime it's not that easy to produce the load on the application right at the time you're looking at the activity monitor. Sql Server 2008 has a new feature called "Data Collection". It might be a good idea to setup this feature and collect performance data for some days or weeks in order so see trends.
For a detailed description as how to setup this feature please refer to the MS-SQL Server Books Online: http://msdn.microsoft.com/en-us/library/bb677356.aspx
Please note that the data collection feature and the jobs it creates can not be deleted again, they can only be "disabled" so they will no longer collect any data.
Memory Settings
You should always limit the maximum memory usage of the SQL Server. In case you have a single instance on the machine, you can limit the memory to the maximum physical memory minus one GB for the operating system.
For example: The machine has 36 GB of memory, you would configure the SQL Server to use 35*1024 = 35840 MB memory, leaving the operating system 1024 MB - which should be enough, usually.
You can configure this using the Microsoft Sql Server Management Studio. Open the properties dialog of your database and adjust the memory settings like shown below.
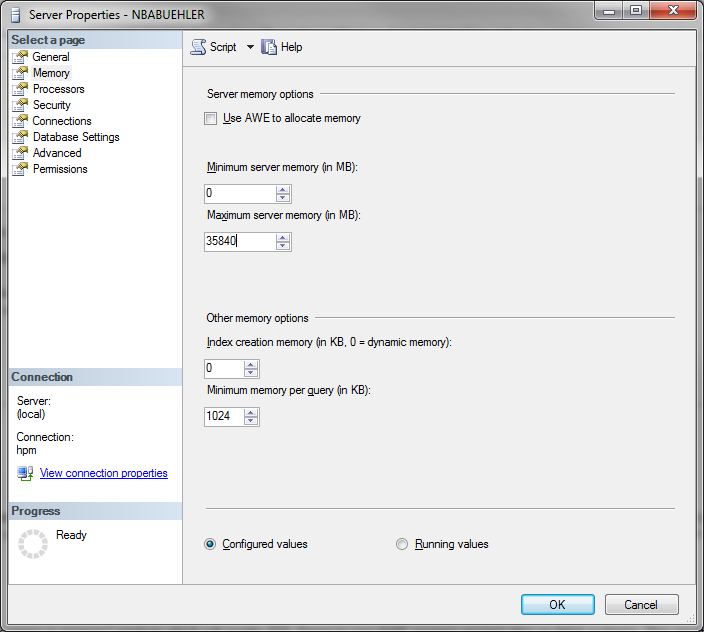
The "Use AWE to allocate memory" will have no effect in 64bit installations, SQL Server uses AWE access automatically when the user has "Lock pages in memory" privilege.
Lock pages in memory
Enable the SQL Server Service user with the "Lock pages in memory" privilege which will enable SQL Server to use AWE memory access also on 64bit systems. This results in a better performance for the memory access since SQL Server can directly access the memory and must not ask for it using the Virtual Memory Manager (VMM).
See also "Configuring the Server for Optimal Performance" (SQL Server 2008 Administration from Wrox Press, Chapter 11, Page 434)
Transaction Logs and the Recovery Mode
In a productive environment you should define the initial size of the database log files to the expected maximum.
For both data and log files we recommend setting a proper growth value because the default of 64MB is too small.
A data base growth action always "stops the world" of the database until the files are enlarged.
When this will occur often it will be a serious performance problem.
In case you are operating the Product 360 databases in FULL recovery mode please make sure that you take backups of the transaction logs on a regular basis.
Otherwise the transaction logs will grow endlessly because SQL Server will not re-use the existing space until a backup was made.
TempDB handling
The TempDB will be used a lot since Product 360 uses transaction mode READ_COMMITTED_SNAPSHOT starting with PIM 7.1.
We recommend to tune the storage and the amount of data files according to the database load.
Trouble shooting
Reporting
A key functionality of the Product 360 - Server is the so called "reporting". A report in our sense is more or less only a list of internal database ID's. The report therefore reflects an arbitrary amount of "objects" in Product 360 - Server, identified by their ID. Reporting is a crucial part of Product 360 - Server since many functions rely on reports. For example the table based views of root entities like items or products, the export and the delete operations as well.
Usage statistics
The Informatica Software Support might ask you to provide usage statistics for the reporting in case we need to trouble shoot an issue of yours, for these you need to execute the following script on each data source (main, master and supplier):
CREATE TABLE [#ReportInstances]( [ReportInstance] NVARCHAR(30))INSERT INTO [#ReportInstances] ( [ReportInstance] ) VALUES (N'ReportStore'), (N'ReportStoreTempA'), (N'ReportStoreTempB')DECLARE @REPORT_TABLE_NAME NVARCHAR(30)DECLARE @ReportInstance NVARCHAR(30)DECLARE @SQL_STRING NVARCHAR(MAX)DECLARE @TMP_SQL NVARCHAR(MAX)DECLARE C0 CURSOR FORSELECT [ReportInstance]FROM [#ReportInstances]ORDER BY [ReportInstance]OPEN C0FETCH NEXT FROM C0 INTO @ReportInstanceWHILE @@FETCH_STATUS = 0BEGIN SET @SQL_STRING = '' DECLARE C1 CURSOR FOR SELECT TABLE_NAME FROM INFORMATION_SCHEMA.TABLES WHERE TABLE_NAME LIKE @ReportInstance + '[0-9]%' ORDER BY CAST(REPLACE(TABLE_NAME, @ReportInstance, '') AS INT) OPEN C1 FETCH NEXT FROM C1 INTO @REPORT_TABLE_NAME WHILE @@FETCH_STATUS = 0 BEGIN IF LEN(@SQL_STRING) > 0 BEGIN SET @SQL_STRING = CONCAT(@SQL_STRING, ' UNION ALL ') END SET @SQL_STRING = CONCAT(@SQL_STRING, 'SELECT * FROM dbo.[' + @REPORT_TABLE_NAME + ']') FETCH NEXT FROM C1 INTO @REPORT_TABLE_NAME END CLOSE C1 DEALLOCATE C1 SET @TMP_SQL = CONCAT('SELECT COUNT(*) AS [Number of Report IDs from ', @ReportInstance, '] FROM (', @SQL_STRING, ') X') PRINT @TMP_SQL EXECUTE sp_executesql @TMP_SQL SET @TMP_SQL = CONCAT('SELECT COUNT(*) AS [Number of Temporary Report IDs from ', @ReportInstance, '] FROM (', @SQL_STRING, ') X WHERE ReportID IN (SELECT ID FROM Report WHERE Purpose = 1)') PRINT @TMP_SQL EXECUTE sp_executesql @TMP_SQL SET @TMP_SQL = CONCAT('SELECT COUNT(*) AS [Number of Permanent Report IDs from ', @ReportInstance, '] FROM (', @SQL_STRING, ') X WHERE ReportID IN (SELECT ID FROM Report WHERE Purpose = 3)') PRINT @TMP_SQL EXECUTE sp_executesql @TMP_SQL SET @TMP_SQL = CONCAT('SELECT COUNT(*) AS [Number of Orphan Report IDs from ', @ReportInstance, '] FROM (', @SQL_STRING, ') X WHERE ReportID NOT IN (SELECT ID FROM Report)') PRINT @TMP_SQL EXECUTE sp_executesql @TMP_SQL FETCH NEXT FROM C0 INTO @ReportInstanceENDCLOSE C0DEALLOCATE C0DROP TABLE [#ReportInstances]SELECT COUNT([ID]) AS repTotalCount, Purpose, SUM([Count]) totalIdsCount FROM [dbo].[Report] GROUP BY Purpose SELECT count([ID]) AS numOfReports, [Count] AS repSize, COUNT([ID])*[Count] AS totalSize FROM [dbo].[Report] WHERE Purpose=1 GROUP BY [Count] ORDER BY totalSize DESC SELECT count([ID]) AS numOfReports, [Count] AS repSize, COUNT([ID])*[Count] AS totalSize FROM [dbo].[Report] WHERE Purpose=1 GROUP BY [Count] ORDER BY numOfReports DESC SELECT count([ID]) AS numOfReports, [Count] AS repSize, COUNT([ID])*[Count] AS totalSize FROM [dbo].[Report] WHERE Purpose=1 GROUP BY [Count] ORDER BY repSize DESC SELECT [Type], SUM([Count]) AS totalSize FROM [dbo].[Report] WHERE Purpose=1 AND [Count] < 10 GROUP BY [Type] SELECT [Type], SUM([Count]) AS totalSize FROM [dbo].[Report] WHERE Purpose=1 AND [Count] < 100 GROUP BY [Type] SELECT [Type], SUM([Count]) AS totalSize FROM [dbo].[Report] WHERE Purpose=1 AND [Count] < 200 GROUP BY [Type] SELECT TOP 100 [ID] ,[Type] ,[Purpose] ,[Count] ,[CreationDate] FROM [dbo].[Report] WHERE Purpose=1 ORDER BY CreationDate DESCSET SERVEROUTPUT ONSET LINESIZE 2000DECLARE REPORT_TABLE_NAME VARCHAR2(30); SQL_STRING VARCHAR2(2000); TMP_SQL VARCHAR2(2000); TMP_RESULT NUMBER; TEMP_NAME NVARCHAR2(30); TYPE TEMP_ARRAY IS VARRAY(3) OF VARCHAR2(30); ARRAY TEMP_ARRAY := TEMP_ARRAY('ReportStore', 'ReportStoreTempA', 'ReportStoreTempB'); CURSOR C1(REPORT_INSTANCE VARCHAR2) IS SELECT TABLE_NAME FROM USER_TABLES WHERE REGEXP_LIKE(TABLE_NAME, '^' || REPORT_INSTANCE || '\d') ORDER BY CAST(REPLACE(TABLE_NAME, REPORT_INSTANCE) AS NUMBER);BEGIN FOR i IN 1..ARRAY.COUNT LOOP TEMP_NAME := ARRAY(i); SQL_STRING := ''; OPEN C1(TEMP_NAME); LOOP FETCH C1 INTO REPORT_TABLE_NAME; EXIT WHEN C1%NOTFOUND; IF LENGTH(SQL_STRING) > 0 THEN BEGIN SQL_STRING := SQL_STRING || ' UNION ALL '; END; END IF; SQL_STRING := SQL_STRING || ' SELECT * FROM "' || REPORT_TABLE_NAME || '"'; END LOOP; CLOSE C1; TMP_SQL := 'SELECT COUNT(*) AS "numIds' || TEMP_NAME || '" FROM (' || SQL_STRING || ') X'; DBMS_OUTPUT.PUT_LINE(TMP_SQL); EXECUTE IMMEDIATE(TMP_SQL) INTO TMP_RESULT; DBMS_OUTPUT.PUT_LINE(TMP_RESULT || CHR(10)); TMP_SQL := 'SELECT COUNT(*) AS "numTempIds' || TEMP_NAME || '" FROM (' || SQL_STRING || ') X WHERE "ReportID" IN (SELECT "ID" FROM "Report" WHERE "Purpose" = 1)'; DBMS_OUTPUT.PUT_LINE(TMP_SQL); EXECUTE IMMEDIATE(TMP_SQL) INTO TMP_RESULT; DBMS_OUTPUT.PUT_LINE(TMP_RESULT || CHR(10)); TMP_SQL := 'SELECT COUNT(*) AS "numPermIds' || TEMP_NAME || '" FROM (' || SQL_STRING || ') X WHERE "ReportID" IN (SELECT "ID" FROM "Report" WHERE "Purpose" = 3)'; DBMS_OUTPUT.PUT_LINE(TMP_SQL); EXECUTE IMMEDIATE(TMP_SQL) INTO TMP_RESULT; DBMS_OUTPUT.PUT_LINE(TMP_RESULT || CHR(10)); TMP_SQL := 'SELECT COUNT(*) AS "numOprhanIds' || TEMP_NAME || '" FROM (' || SQL_STRING || ') X WHERE "ReportID" NOT IN (SELECT "ID" FROM "Report")'; DBMS_OUTPUT.PUT_LINE(TMP_SQL); EXECUTE IMMEDIATE(TMP_SQL) INTO TMP_RESULT; DBMS_OUTPUT.PUT_LINE(TMP_RESULT || CHR(10)); END LOOP;END;/SELECT COUNT ("ID") AS "repTotalCount", "Purpose", SUM ("Count") AS "totalIdsCount" FROM "Report" GROUP BY "Purpose";SELECT COUNT ("ID") AS "numOfReports", "Count" AS "repSize", COUNT ("ID")*"Count" AS "totalSize" FROM "Report" WHERE "Purpose"=1 GROUP BY "Count" ORDER BY "totalSize" DESC;SELECT COUNT ("ID") AS "numOfReports", "Count" AS "repSize", COUNT ("ID")*"Count" AS "totalSize" FROM "Report" WHERE "Purpose"=1 GROUP BY "Count" ORDER BY "repSize" DESC; SELECT "Type", SUM ("Count") AS "totalSize" FROM "Report" WHERE "Purpose"=1 AND "Count" < 10 GROUP BY "Type";SELECT "Type", SUM ("Count") AS "totalSize" FROM "Report" WHERE "Purpose"=1 AND "Count" < 100 GROUP BY "Type"; SELECT "Type", SUM ("Count") AS "totalSize" FROM "Report" WHERE "Purpose"=1 AND "Count" < 200 GROUP BY "Type";SELECT "ID", "Type", "Purpose", "Count", "CreationDate" FROM "Report" WHERE "Purpose" = 1 ORDER BY "CreationDate" DESC;Cleanup all temporary reports
The Product Manager uses an automatically scheduled system job for to delete temporary reports which are older than one day. This job is scheduled every hour (by default), therefore the Report table should not have any entry with Purpose=1 (temporary) which are older than 24 hours. However, it occurred in the past that this job could not fulfill its task in a reasonable amount of time or due some misconfiguration.
Prior to Version 6.0 this job deleted all reports (and their corresponding entries in the ReportStoreTemp table) in a single transaction. This may lead to an "explosion" of the transaction log since the ReportStoreTemp table might contain millions of items. In case you find old reports in the Report table (in any Product 360 - Server schema) you can execute the following SQL statements to completely delete all temporary reports in one small step, keeping the transaction log usage low.
Please note that you should shutdown the Product 360 - Server during this - since currently running operations might rely on a temporary report.
DELETE FROM [Report] WHERE [Purpose] = 1TRUNCATE TABLE [ReportStoreTemp]With PIM - Server versions >= 6.0 the delete job is more aware of this problem. Big reports will be deleted one by one, small reports in a bulk delete operation. You can configure the boundaries of "big reports" in the plugin_customization.ini file. Additionally to that, the delete job can also be configured to delete reports which are younger than a day - for example a few hours.
Separate storage for reporting tables
On heavy load databases we recommend to put the corresponding reporting tables for each schema:
Report
ReportStore
ReportStoreTempA
ReportStoreTempB
on a high-performance storage separated from the rest of the Product 360 tables.
Create missing entries Item/Product/Variant/Structure-attributes in repository key language
This can happen if the language of the repository got changed during maintenance, if there is any custom code in the system which adds entries by not honoring the key language or an import which is ignoring the fact the the key language should be filled always. The repository language is configured in the server.properties and should get never touched in a running system.
Since PIM 7.0.01 the Product 360 Core will check this behavior during server startup. The server won't start If there are not all attributes maintained in the repository key language.
The occurred message in the server log file will look like this:
The database 'HPM_MAIN' contains invalid structure feature entries. '3' entries have been found which aren't maintained in the repository language German.Solution
Create the entries for the missing language. The provided script is checking the item attributes and structure attributes. It will lookup of the missing data entries and copy an existing entry with the lowest language ID for the missing repository language.
Because the name of the created attribute has to be unique, the name will be '<name of the attribute to copy><defined delimiter in the cmd file><id of the attribute to copy>' . This name will be cut at the cmd defined length (by default DB 'Name' column length).
It is possible that this script creates invalid data if the attribute name of the the attribute to copy is as long as the defined max length in the cmd file and this name is already used by another attribute in the same context.
createMissingAttributes_mssql_pim7.rar
createMissingAttributes_oracle_pim7.rar
Consequences
The repository language MUST NOT be changed as soon as entity data such as items/products/variants or structures/structure groups have been created and exist in the database. In such a situation, the stability of the system can no longer be guaranteed since logical key fields most likely will contain null values.
MS-SQL Server
"The query processor could not start the necessary thread resources for parallel query execution"
During high-end benchmark tests the following error message has been thrown by the SQL Server "The query processor could not start the necessary thread resources for parallel query execution". After some research we came to the conclusion that the only currently known solution to this problem is to reduce the load on the database server. Several articles from Microsoft or Microsoft close resources explained this to be the only way to avoid this problem. See also this article from Microsoft: http://msdn.microsoft.com/en-us/library/aa337448.aspx
So, how to reduce the load on the database server? First approach is to reduce the number of concurrent connections using the DB Connection pool settings as described in the Tuning Advisory. Additionally to that please always inform the Informatica Software Support. It will be very helpful if you can describe which action lead to the error, steps to reproduce would be great too since we're constantly investigating this issue and try to find a better solution.
In case this problem occurs often on your system you might want to observe the processor queue, this can give us hints on the processor utilisation at the time the error occurred.
"Transaction (Process ID XXX) was deadlocked on lock resources with another process and has been chosen as the deadlock victim. Rerun the transaction"
In case you encounter database deadlocks you can use SQL Server Profiler to find the cause for the particular deadlock.
You need to run a server-side trace to capture deadlock information, you can use the script available here: http://www.sqlservercentral.com/scripts/deadlock/66808/
Once the deadlock has occurred, you can read the trace file with the script available here:
http://www.sqlservercentral.com/scripts/deadlock/66809/
The content of the trace file will show which transactions resp. which SQL statements are responsible for the deadlock so further actions can be taken.
Oracle
Import/Export of schemas
To obtain some prepared notes on how to import export schemas from/to an Oracle instance, please raise a request with Informatica.
Connection Issues
If your project is having sporadic connection issues with Oracle database maybe these topics are helpful:
Maximum amount of processes. Because there were more than one application on the Oracle database the number of 300 was too small. We had good experiences with 1000 (minimum 300 x count of applications)
open_cursors, also too small values. We had good experiences with 1000 (minimum 300 x count of applications)
Log-Files are full. Mostly the Listener log file.
Switch off listener logging
Carry out following steps to configure the listener logging:
Open listener.ora in ..\product\11.2.0\dbhome_1\NETWORK\ADMIN
Add LOGGING_<Listenername> = OFF
Replace <Listernname> through your listernname e.q. 11GR2
Save the changes
Restart db and listener service.
Possible Values:
[ON| OFF]
tempdb full. Index rebuild after installation of standard classification systems!
Audit-Trail: waste logs also and makes them full. Towards description of Oracle the parameter „audit_trail“ is NOT deactivated per default! We deactivated this parameter on all of our instances.
Attention: when applying changes via enterprise manager console please ensure that the changes are applied in spfile, too.
Oracle JDBC driver OutOfMemoryError / huge memory consumption
Oracle JDBC driver may course OutOfMemoryError. The reason is that Oracle driver tries to allocate huge buffer for the incoming data. Sizes of these buffers depend on a single result set row size and 'prefetchRowSize' parameter of the prepared statement. By default this parameter is set to 10, but to increase list model performance it has been set to 10000 for all fragment SPs calls.
There are following different ways to avoid OutOfMemoryError in the oracle jdbc driver:
Use jdbc driver parameter to limit buffer size in the UDA configuration file:
<property name="connectionProperties">oracle.jdbc.maxCachedBufferSize=<sizeInBytes>;</property>Set 'rowPrefetchSize' in the com.heiler.ppm.fragment.server.fragment extension point to override the global value for a certain fragment
Set 'defaultRowPrefetchSize' in the com.heiler.ppm.fragment.server/preferences.ini or in the plugin_customization.ini
# Global value to control number of rows that will be fetch from the database in one round-trip# using fragment stored procedure. It helps jdbc driver to find trade-off between memory consumption# and db fetch performance. Default value set by many jdbc drivers is 10, but to improve list model data access# we need to set this value to a much higher value.## Some JDBC driver implementations use this value to estimate incoming raw data buffer size as# defaultRowPrefetchSize*rowSize. Such buffers may have very large size (several hunderd megabyte).# Set this parameter to a low value if application server has small amount# of memory. You can also experiment with this value if garbage collection pessure is too high.## This global value can be overriden per fragment using optional 'rowPrefetchSize' attribute of the# com.heiler.ppm.article.core.server.Fragment extension point. It is recommended to use this attribute if# the average number of rows returned by the fragment can be estimated in development time.# defaultRowPrefetchSize = 10000See Oracle JDBC MemoryManagement for more info
Oracle JDBC driver OutOfMemoryError (Cache)
The listModel (Product 360 - Server Table) access with NCLobs may result in an OutOfMemoryError.
The reason of this dump is oracle driver cache for CLOB fields. JDBC statements hold references to huge byte arrays.
This strategy usually reduces number of DB round-trips and improves performance but it is takes a lot of memory.
Try setting oracle.jdbc.FreeMemoryOnEnterImplicitCache connection property to true. This will instruct Oracle driver to do cache clean-up more frequently.
see oracle driver do for more detail: http://download.oracle.com/docs/cd/E14072_01/appdev.112/e13995/oracle/jdbc/pool/OracleDataSource.html
Oracle ReportStoreTemp performance
Product 360 - Server reporting framework uses ReportStore and ReportStoreTemp tables to save report ids.
Under heavy load report save rate can be very high and ReportStoreTemp tables may grow up to dozens of million records.
If possible we recommend putting these tables on a high performance storage.
Automatic expiration of passwords for Oracle DB users
When setting up the Oracle DB and the users needed for Product 360 it is important to not set the password of each of them to automatically expire. Once the expiration date is met the Product 360 Server and components will not be able to start up anymore.