Monitoring with Micrometer
General monitoring approach
The Product 360 server exposes several metrics leveraging the micrometer library (https://micrometer.io/). These monitoring systems are supported by the Product 360 server:
CloudWatch
Graphite
NewRelic
Dynatrace
Elastic
Prometheus
Configure the monitoring system you want to use in the micrometer.properties file located in <PIM_SERVER_INSTALLATION_ROOT>\server\configuration\HPM\micrometer.properties of the server installation package to expose metrics. The application server needs to be restarted in order to have changes take effect. A list of JVM default metrics will be exposed as well as Product 360 custom metrics. Find a list of the available custom metrics below.
List of Product 360 custom metrics
|
Meter name in prometheus endpoint |
Tags |
Description |
queue_messages_read_total |
queueName - Name of the monitored queue |
Number of messages this Product 360 server has read from the queue with queueName |
queue_messages_read_success_total |
queueName - Name of the monitored queue |
Number of messages this Product 360 server has successfully processed after it read them from the queue with queueName |
queue_messages_read_error_total |
queueName - Name of the monitored queue |
Number of messages this Product 360 server has read from the queue with queueName, but errors occurred when they were processed |
queue_messages_write_total |
queueName - Name of the monitored queue |
Number of messages this Product 360 server has written to the queue with queueName |
queue_messages_write_error_total |
queueName - Name of the monitored queue |
Number of messages this Product 360 server has tried to write to the queue with queueName, but failed to do so |
Sample for monitoring a Product 360 server with Micrometer, Prometheus and Grafana
Architecture overview to monitor Product 360 servers with Micrometer, Prometheus and Grafana.
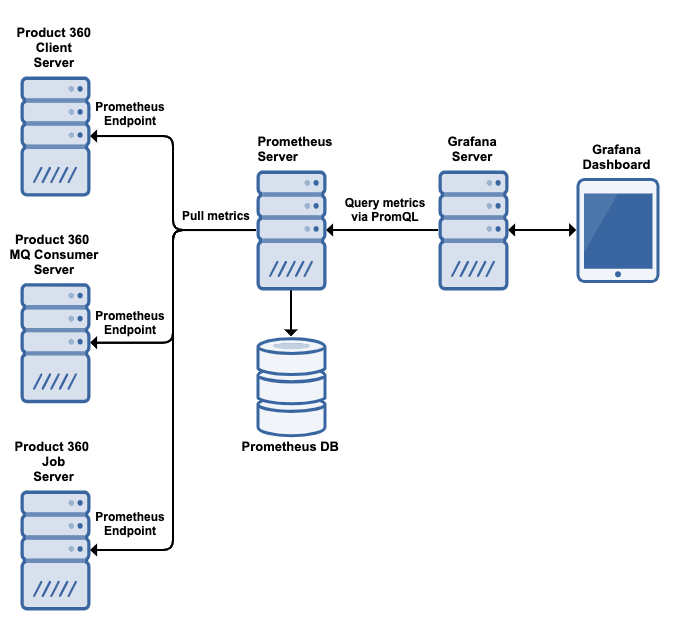
The following steps are required to enable monitoring of Product 360 server with Micrometer, Prometheus and Grafana.
Enable the Prometheus endpoint for the Product 360 server you want to monitor by adjusting the values in the file micrometer.properties:
Micrometer settings in micrometer.properties
#############################################################################
### Prometheus settings                                                   ###
#############################################################################
prometheus.enabled         = true
prometheus.uriPath         = /prometheus
prometheus.port            = 9090
prometheus.descriptions    = true
#prometheus.step            =
As a minimum enable prometheus, set the uriPath and the port number
Restart the Product 360 server
Verify metrics are available by accessing the Prometheus endpoint you specified. In this sample http://<your_server_hostname>:9090/prometheus
Use a Prometheus server to pull the metrics from the Product 360 endpoints and to write them into a database. You need to add the Product 360 Prometheus endpoint as a scrape target to the prometheus.yml file. For details check the Prometheus configuration documentation
Use a Grafana server to visualize the collected metrics data in Prometheus. Therefore Prometheus is added as data source to Grafana and the meters are queried using PromQL (Prometheus Query Language). To visualize the JVM default metrics you can import one of the available Grafana template dashboards as for instance: https://grafana.com/grafana/dashboards/4701 To visualize the Product 360 custom metrics you can build your own dashboard and query them by the names listed in the custom metrics table or you can import the Product 360 dashboard containing the Product 360 custom metrics. Product_360_Grafana_Dashboard.json Specify your Prometheus server as data source during import.