Server Operation
Startup & Shutdown
TODO MSpiegel general
Maintenance Tasks
Backup Strategy
Backround job should be configured to be automatically deleted after a certain amount of time.
See Server Job Maintenance for details.
Monitoring
Monitoring tools which can communicate using the SNMP protocol can be used to monitor the Product 360 application servers. Please see SNMP Monitoring for configuration details on the SNMP functionality.
Additionally micrometer metrics are available. See page Monitoring with Micrometer for more information.
Tuning
Here is the list of settings and configuration options that may affect system performance. These settings depend on system workloads, hardware and environment.
Memory Settings
As expected, the memory settings are crucial for the application server of the PIM - Server. You can configure the available memory in the <installation root>/_environement.conf file. Please note that you can configure the maximum amount of memory (MEM_MAX).
The minimum amount of available heap memory will always be set to the same value as the MEM_MAX, since for an application server it makes no sense otherwise.
Garbage Collection
Garbage collection configuration is a very complicated thing to do. Informatica PIM Software engineers spend a lot of time on site with customers to find the right garbage collection algorithm and settings. All needed parameters have already been adjusted by us, the only configuration which is needed for every customer installation is the number of garbage collection threads which can be used. PIM - Server uses a parallel garbage collection algorithm, therefore you can decide how many threads the garbage collection can use. The GC_THREADS setting in the <installation root>/_environment.conf file should be set to about 75% of the available CPU cores. For example, in case you have 8 Cores (including hyper-threading cores), you would set this to about 6 threads.
In case you need to further adjust the garbage collection settings you can do so in the <installation root>/service/wrapper.conf file in the GC OPTIONS section. Please note that the console_debug.cmd launch file will use different garbage collection algorithms since the debug mode is not able to handle the ones we use for production.
GC activity log
In order to analyze the GC events in detail you can use the GC activity log for each Product 360 Server located in the <installation root>/logs folder. GC activity logs are enabled per default for all Product 360 Servers.
Each Server start produces a new gc_<timestamp>.log.* file (whereas <timestamp> is the starting time of the Product 360 Server) in the server's log folder.
Analyse GC activity log & optimize
The GC activity log can be analyzed e.g. online via http://gceasy.io/. Common issues and optimization possibilities are:
The "GC pause duration time" specifies the length of the time intervals, where the garbage collector runs exclusively and therefor pauses all other application threads. If the "GC pause duration time" is above 10 seconds, the Product 360 Server application runs into trouble, because there are continuously running heartbeats (e.g. for the Hazelcast Framework, which have a timeout of 10 seconds. This can result in operation timeouts in the log file (e.g. HazelcastOperationTimeout)
For optimization: consider increasing heap memory (MEM_MAX in <installation root>/_environement.conf file)
The "object creation rate" (for http://gceasy.io/: see table "Object stats", row "Avg creation rate") specifies the heap memory size, which is allocated per second by new created java objects. If there are problems with operation timeout exceptions in the log due to long "GC pause duration time"(see the explained issue above) AND the "object creation rate" is also very high (somewhere above 1 GB/s), then the garbage collector is maybe running too late and then is not able to free memory in less than 10 seconds. By default the garbage collector G1 begins to work, when 45% of the heap memory is in use. This is specified by the parameter "InitiatingHeapOccupancyPercent", which has a default value of 45.
For optimization: consider decreasing the"InitiatingHeapOccupancyPercent". Therefor add -XX:InitiatingHeapOccupancyPercent=30 (or even 20 or 10) to GC OPTIONS section in <installation root>/service/wrapper.conf
Find general information about the used Garbage collection algorithm G1 here: https://www.oracle.com/technetwork/tutorials/tutorials-1876574.html
Communication Framework
Number of worker threads in server network settings
Mass-Data Parallel Processing
Item Processor Threadpool
Media Asset Parallel Management
There are several registered MBeans under the category com.heiler.ppm → MediaAssetParallel with the JMX interface which are appliced to observe and improve the performance in run time.
CreateZipManagement
It provides the management of the thread pool and other relevant parameters(e.g. the size of the BlockingQueue to avoid OutOfMemoryError) by zip creation phase.
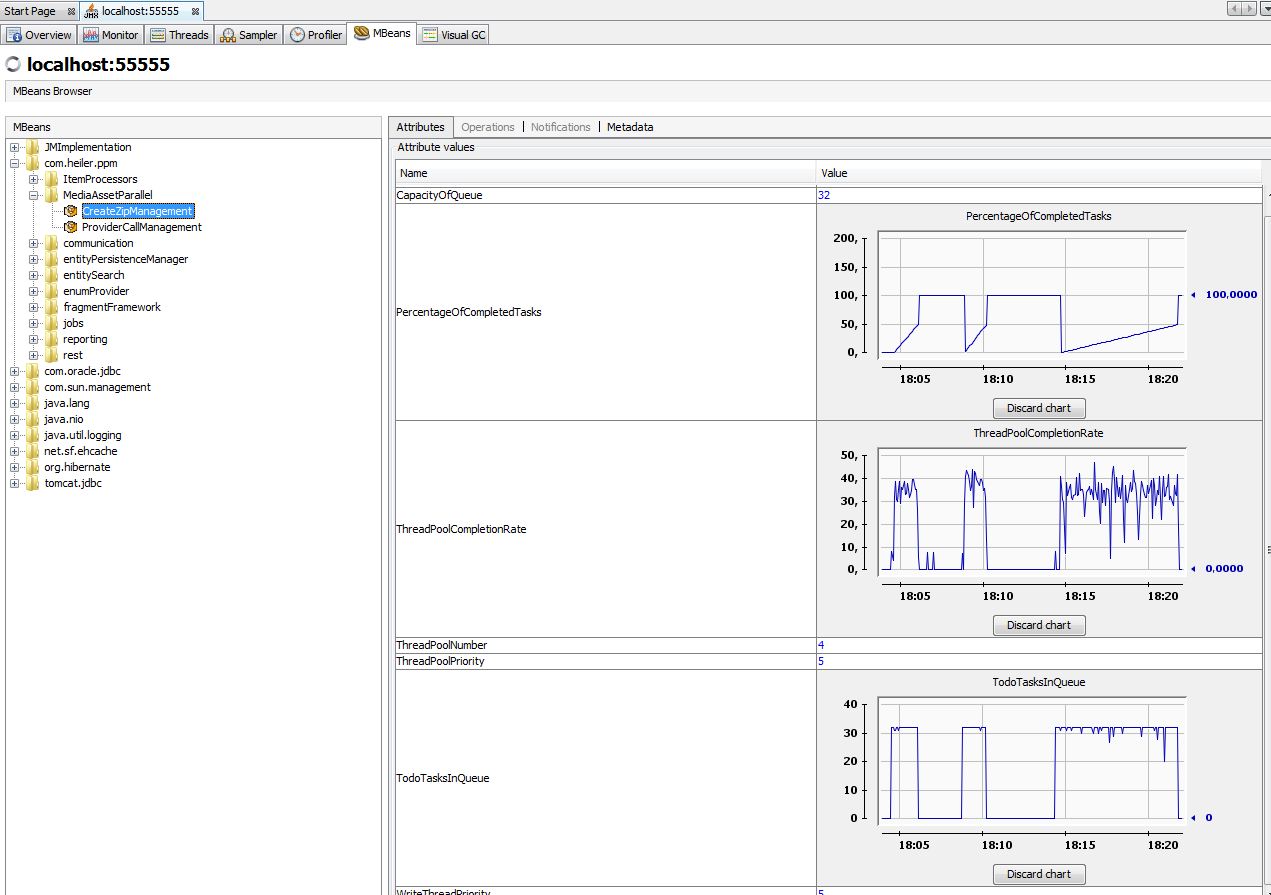
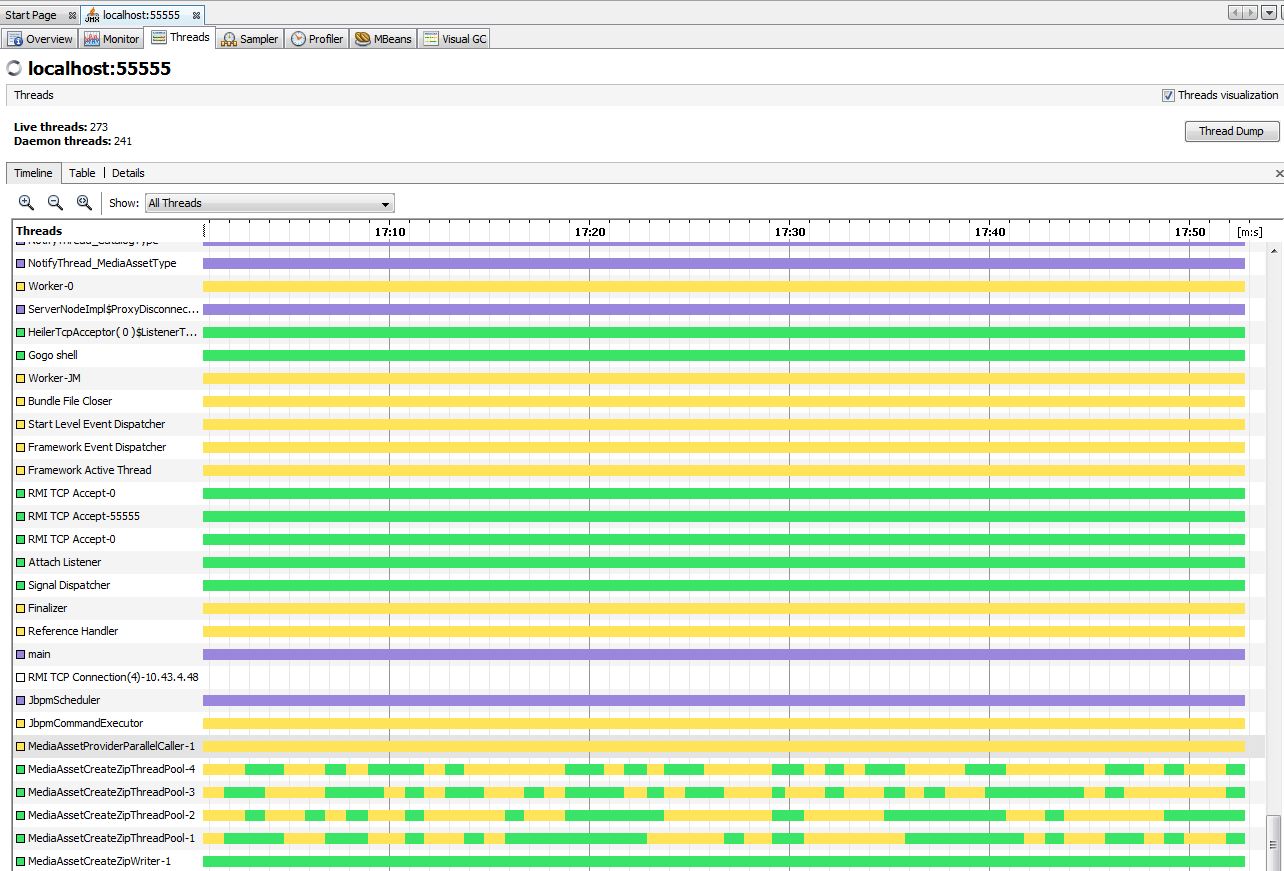
The following screenshot indicates the corresponding threads in run time.
MediaAssetProvider special MBean
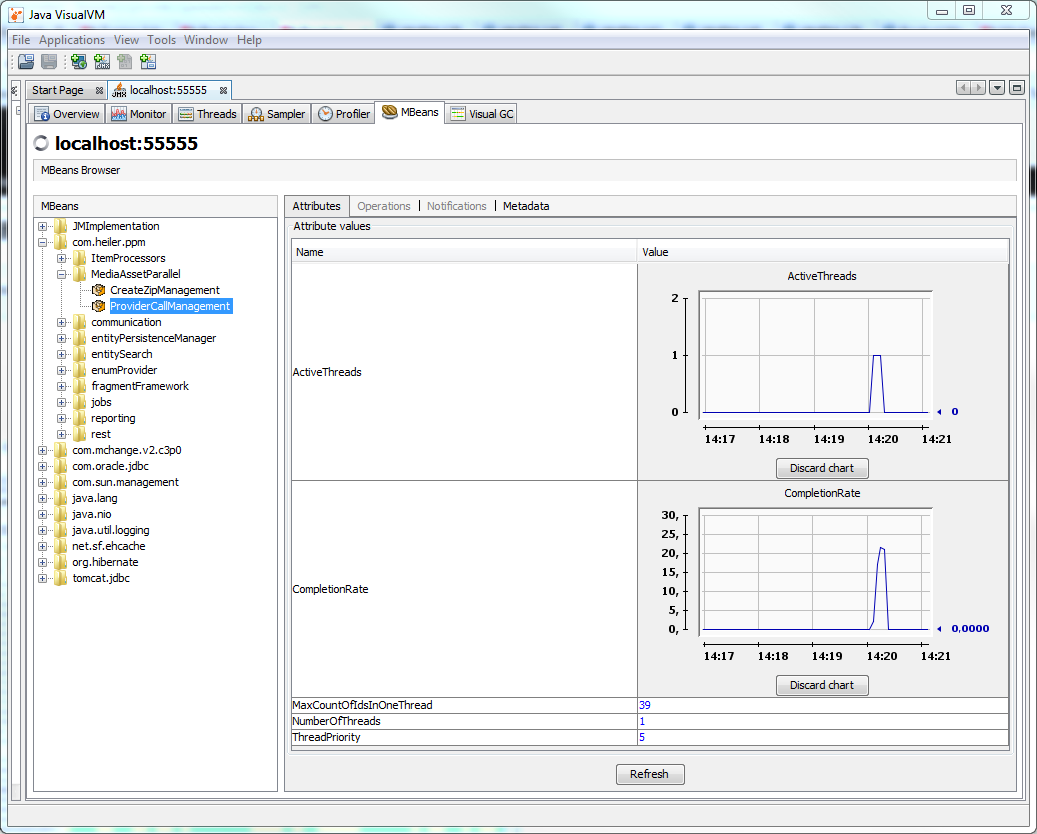
MediaAssetProviderParallelManager
It was named as "ThreadPoolManagement", and changed as "ProviderCallManagement" and then as "MediaAssetProviderParallelManager" since 7.1.01.00.
It provides the management of the multi-threads call for the corresponding MediaAssetProvider methods.
A special thread pool is applied to improve the performance for some methods of the default IMediaAssetProvider, such methods should have any parameter composed of a long id list(e.g. getUNCpaths( String[] identifiers, ... )). Currentliy only the PIM - Media Manager 'HMM' MediaAssetProvider supports it. This thread pool settings can be observed and adjusted with the JMX interface during runtime. It is meanful for some scenarios like export with mass data.
The following screenshot indicates the thread pool utilization. The user can adjust the values of the attributes "MaxCountOfIdsInOneThread" and "NumberOfThreads" to improve the performance, if the "ActiveThreads" reachs always the maxmum value and the "CompletionRate" is but too low.
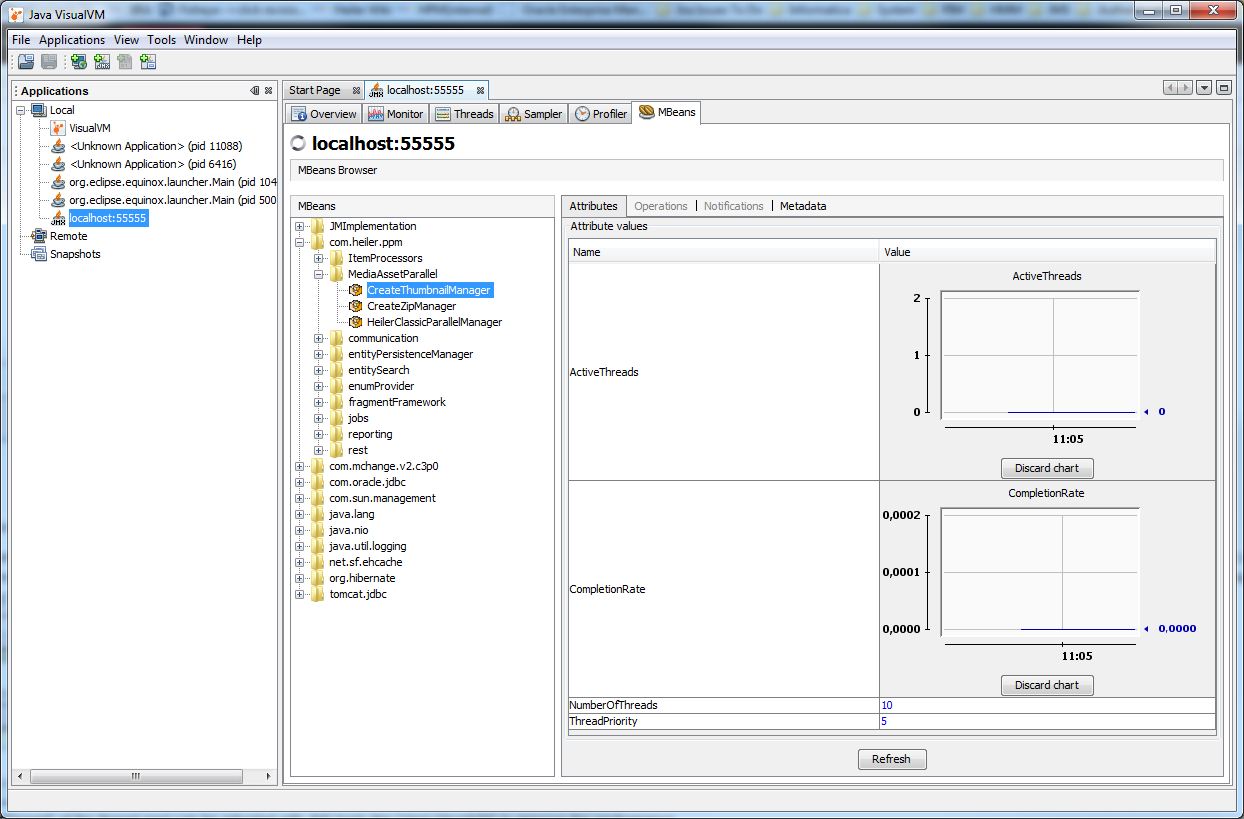
HeilerClassic special MBeans
since 7.1.01.00 HeilerClassic registers two MBeans which can be also observed and adjusted with JMX interface.
CreateThumbnailManager
It provides the management of thread pool which schedules all graphicsmagick convert jobs to create thumbnails. The default NumberOfThread is 10.
HeilerClassicParallelManager
It provides the management of thread pool which schedules tasks which can be performed parallelly for the corresponding MediaAssetProvider methods(e.g. GetSubCategoriesTask).
Database Connection Pool
The database connection pool settings can be adjusted in the corresponding configuration files. More detailed information on the configuration of the connection pool can be found here DB Connection pool. During runtime the connection pool utilization can be observed with the JMX interface (see Screenshot). Most important here is the maximum used attribute which indicates if the maximum number of connections has already been used. You might need to increase the maximum connections in case the limit is reached often, or continuously.
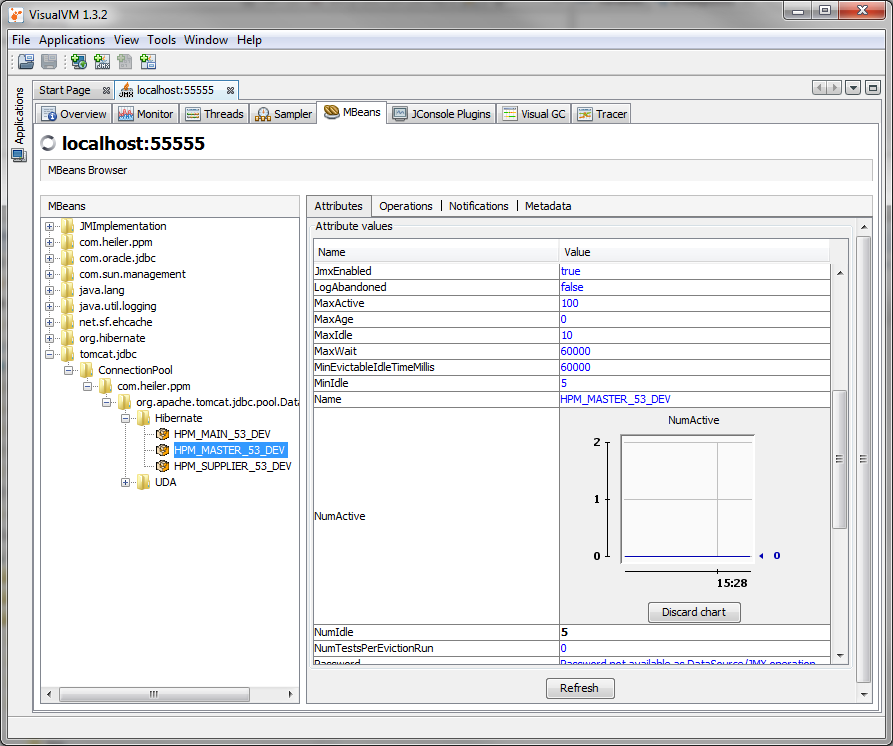
This screenshot shows the NumActive attribute of the ConnectionPool for the HPM_MASTER connection pool. Currently there are zero connections in use. When this number reaches the MaxActive limit, the application load might be to high for the number of connections, adjusting the connection pool is neccessary then. Additionally to NumActive and MaxActive you might want to check the WaitCount, which indicates how long a thread needs to wait until it aquires a connection from the pool. In case there are enough connections left in the pool, this number should be about zero.
The PIM - Server has two connection pool configurations which are of interest here, the Hibernate and the UDA one. The Hibernate pool is used for detail model persistence, therefore it's utilized in detail model modifications, import and merge. The UDA pool is used mostly for read-only mass-data retrieval like list model based functionality such as table views and export.
Logging
PIM - Server has a central configuration file for all logging activities in the server, as well as in the client. By default the logging trace levels are set to INFO, thus logging messages with severity INFO, WARNING and ERROR will be logged in the console log, errors additionally in the error.log file. Please make sure that TRACE or DEBUG severity levels are disabled in production environments, since they dramatically slow down the performance.Logging is configured in the <installation root>/configuration/hpm/log4j.xml file.
Import
Preferences regarding CPU usage
Especially in Single Server scenarios in which the Import Jobs are executed throughout the day, it might be necessary to limit the CPU resource consumption of a single import process.
For this there are several preferences available which can be set in the plugin_customization.ini file.
# Specifies the maximum number of threads used for importing objects.
# Default is twice the number of cores.
# Allowed value is an integer greater than 0.
# com.heiler.ppm.importer5.core/importer.maxThreads=2
# Factor for the number of parallel threads.
# The number of parallel threads is computed by multiplying the number of cores and this factor.
# The result is rounded.
# Value is a double; default is 2.0
# This value is only considered if importer.maxThreads is not set.
com.heiler.ppm.importer5.core/importer.parallelThreadsFactor = 2.0
# Allow to limit number of the import jobs running in parallel
# Only the actual database import (phase 2) is limited.
# -1 means unlimited (default)
com.heiler.ppm.importer5.core/importer.maxNumberOfDatabaseImportsAtSameTime = -1
Additionally to these global settings, a user can activate the so called "debug mode" for the Import by pressing
Shift + F12 when inside of the Import Perspective in the Desktop Client. With activated debug mode, additional settings are available when scheduling the import.
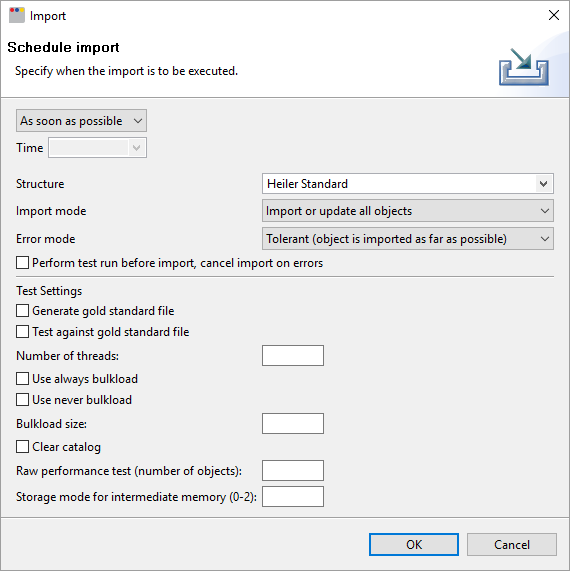
Please do not change any of those additional settings except the Number of Threads!
Preferences regarding memory usage
When importing CSV or Excel files, per default all rows are read into heap memory in order to presort them. This speeds up processing if the data for one item is stored in rows that are spread. So when importing large CSV or Excel data files, consider to increase the job servers' heap size accordingly.
If presorting is not needed (because the data files are already presorted) or desired, it can be disabled by adding the following preference in the server's plugin_customization.ini: com.heiler.ppm.mapper.core/presortRowsDefault = false
Importing large data files might become slower, when presorting is deactivated (see preference above) and the import data file is not already presorted.
Trouble Shooting
Log files
What's needed for a support call
Anti-Virus Software affecting performance
In the past we had some customer performance issues which were bound to the anti-virus scanning on the application server. Although we can not say that this is always the case for all deployments or all anti-virus products, we do recommend to exclude the PIM relevant directories from the scanning if applicable by the customers local security policy. If scanning can't be avoided in your situation, you should consider to reduce the lifetime of import or export jobs. The shorter they are, the less files will be in the import/export directories - which might increase scanning performance again.
Media Asset Provider (Classic Provider)
No preview are visible
Ensure following things:
Is the file extension unsupported?(E.g. pdf, ps, eps files because the ghostscript is not supported in PIM any more)
Is the graphicsMagick(official verified version GraphicsMagick-1.3.14-Q16) installed?
Check that the blacklistExtensions parameter of the C:\heiler\server\configuration\HPM\plugin_customization.ini file does not contain the file extension
Has the user who has started the application server write access to the media foler defined in the "Media Asset Server (MAS) Settings" section of the server.properties file?
Is it possible to open the image files from another computer by the explorer and another program?Important: An unsuccessful rendering of a thumbnail leads to an entry in the database table MediaAssetFile" of the "[db_prefix]_MAIN_[db_suffix]" database.
Therefore, after a "subsequent" adjustment of these points this table must be modified. Set the bit-field "SupportThumbnail" to NULL.
Check 3rd party tools:
The technical background is that PIM - Server runs on a 64-bit machine as a 64-bit Java process.
PIM - Server starts gm.exe (Graphicsmagick) in a several process space (Graphicsmagick is a 32-bit process).
Obtain a Memory Dump (Heap Dump) from the Java Virtual Machine
There are several ways to obtain a heap dump during runtime.
Heap dump on out of memory
By default all Product Manager launch configurations (development and runtime) contain the Java parameter -XX:+HeapDumpOnOutOfMemoryError which performs a heap dump when an out of memory error occurs.Heap dump on Ctrl+Break
Beginning with Java Version 1.5.0_16 the Java VM supports the -XX:+HeapDumpOnCtrlBreak parameter which will create a heap dump when you press Ctrl + Break in the Java console. For this the PIM - Server must be started with the debug_console.cmd file.Heap dump via jcmd utility
This console utility is included in JDK. Use "jcmd <processId> GC.heap_dump <filename>" for creating a heap dump, e.g. "jcmd 14904 GC.heap_dump D:\heapdump.hprof"
For details see https://docs.oracle.com/javase/8/docs/technotes/guides/troubleshoot/tooldescr006.html.
We suggest to use the Eclipse Memory Analyzer to analyze the Heap Dump, especially in case you have large heap sizes. It's the only tool we know so far which is able to open large heap dumps at all (you will need a lot of memory during the indexing of the heap dump in the memory analyzer - but this must not be physical memory ![]() )
)
Enhanced Logging for Assortment Content Calculation
In case there are issues in terms of an assortment's content and there are items included/excluded which do not fit to the defined assortment rules, please add the following lines to the server's log4j.xml and execute an assortment update:
<appender name="AssortmentFileAppender" class="org.apache.log4j.RollingFileAppender"> <param name="File" value="logs/.assortment.log"/><!-- = Runtime directory --> <param name="MaxFileSize" value="10240KB"/> <!-- = 10MB --> <param name="MaxBackupIndex" value="10"/> <param name="Threshold" value="TRACE"/> <layout class="org.apache.log4j.PatternLayout"> <!-- The default pattern: DateTime Priority [Thread] [Category] Message\n --> <param name="ConversionPattern" value="%d{ISO8601} %-5p [%t] [%c{1}] %m%n"/> <!-- Pattern to output the caller's file name and line number --> <!-- param name="ConversionPattern" value="%d{ISO8601} %-5p [%t] (%F:%L) - %m%n"/--> </layout></appender> <!-- Default logging level for assortment modifying and updating.This category uses its own appender and does not route log events to other appenders.Use "TRACE" to activate assortment loggers --><category name="assortment" additivity="false"> <priority value="TRACE"/> <appender-ref ref="AssortmentFileAppender"/></category> The enhanced logging will write detailed messages regarding assortment content calculation to .assortment.log file located in the server's logging folder. Please provide this log file to Informatica support.
Server and client in different time zones
At the moment it is only possible to use P360 server and client in different time zones with a max time offset of 23 hours.
Theoretically it is possible to have a server client constellation with a 26 hour offset. This is not supported. More than 23 hours offset ends up in exceptions like
java.lang.IllegalArgumentException: Timestamp format must be yyyy-mm-dd hh:mm:ss[.fffffffff] at java.sql.Timestamp.valueOf(Timestamp.java:237) ...Cluster
Since 8.1.1.04 there is a file located at <sharedFolder>/shared/locks/datagrid/eventinfo.txt which shows the current state of the cluster of Product 360 servers.
This file is useful for trouble shooting fail over issues.
Usage of strong cryptographic algorithms to encrypt/decrypt secure information
It is not longer necessary to enable the strong cryptographic algorithms manually. Unlimited cryptographic algorithms are enabled by default.
Nevertheless if you run into errors during encryption/decryption in Product 360, saying you're using an illegal key size you might need to enable the unlimited cryptographic algorithms manually.
This can be done by changing the configuration in file <PIM ROOT>\server\jre\lib\security\java.security. Enable the property 'crypto.policy=unlimited' to activate the unlimited cryptographic algorithms.
This applies for all Modules of Product 360 running with JRE like Supplier Portal or Media Manager. If necessary please adjust the jre\lib\security\java.security of the corresponding Product 360 module.