Audit Trail Migration
The Audit Trail migration consists of two parts, software migration and data migration.
Pre-Migration Checklist
P360 Server and Desktop are updated to the latest version
Legacy audit trail database is still available and preparation DB script has been executed on this audit trail database
The repository is completely configured for the new audit trail
Part 1: Migrate to new Audit Trail module
As the audit trail feature is delivered as part of the Server and Desktop Client package, nothing needs to be done here.
Part 2: Migrate existing data
With Product 360 10.1 the audit trail component has been redesigned. Instead of storing changes in a relational database, they are now stored in Elasticsearch in the form of a JSON document.
With the data migration it is possible to convert old database entries into such JSON documents to keep them accessible in the system.
General process
The migration has been implemented as a simple "read - transform - write" cycle.
Beginning with today and going backwards up to the defined migration date, data chunks of 10,000 changes will be processed. They are read from the old audit trail database and if the root entity is configured to support audit trail it is transformed into the new JSON document structure and written to Elasticsearch.
The user can cancel the job at any time. The job will write a file to the shared folder indicating where it stopped so that it can continue with its work if the job is started again.
Database preparation
There are update scripts for Oracle and MS SQL Server database to
speed up the migration
.
Scripts are available in the configuration folder of the audit trail migration: <PIM_SERVER_INSTALLATION_ROOT>
\configuration\HPM\audittrail\migration\dbPreparationScripts
The corresponding script
has to be executed on the legacy audit trail database before migration can be started. During the script execution the unnecessary audit trail indexes will be deleted and new optimized index(es) will be created. Please note that this can take a few hours, depending on the database size.
Configuration
Repository
Please ensure the repository has all needed audit trail configurations in place. This is important because only data for audit trail enabled root entities will be migrated, all other data will be skipped.
The entities in the 10.1 repository enabled for audit trail do not exactly match those in previous versions. Please check all settings and adapt them to your needs.
In addition to the root entity audit trail settings, the "Supports Audit Trail" setting for repository fields will also be checked. Only audit trail enabled fields and logical keys will be migrated.
Furthermore, the mandatory attribute "short identifier" must have a valid value for all active entities, logical keys and fields. You can check your repository by starting a validation in the repository editor.
audittrail.migration.server.properties
The access to the legacy audit trail database should be configured in <PIM_SERVER_INSTALLATION_ROOT>\configuration\HPM\audittrail\migration\audittrail.migration.server.properties file.
This file can be created from a corresponding template file. The essential settings here are the host and schema configuration. You can take the settings from the old configuration for audit trail.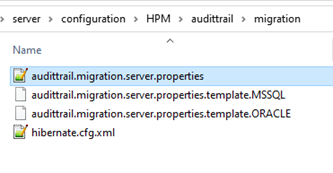
### General Hostdest.host = host### Default database settingsdb.default.type = MSSQL...### AuditTrail database/schemadb.audittrail.schema = HPM_AUDITTRAILdb.audittrail.schema.backup = ${db.audittrail.schema}_BAKdb.audittrail.server = ${dest.host}db.audittrail.port = 1433db.audittrail.user = userdb.audittrail.password = passwordplugin_customization.ini
In order to use the migration you have to configure the time period for which you want to migrate changes. In addition to that, you can configure system resources to be used. The affected configuration file is <PIM_SERVER_INSTALLATION_ROOT>\configuration\HPM\plugin_customization.ini.
|
Property |
Description |
|
com.heiler.ppm.audittrail.migration.server/migrationToDate com.heiler.ppm.audittrail.migration.server/migrationFromDate |
Both dates define the time span for which legacy audit trail data is to be migrated:
migrationToDate is mandatory,
|
|
com.heiler.ppm.audittrail.migration.server/locale |
Locale to be used for the audit trail migration job. The locale is needed to resolve labels of the objects to be migrated. When the data was written, the locale configured for the attribute audittrail.atcsbuilder.locale in the audittrail.properties file was used. The same value should be used for the data migration. Default value: en_US |
|
com.heiler.ppm.audittrail.migration.server/migration.fetch.size |
Fetch size used for database read access when retrieving migration data from the legacy audit trail database. In case of memory issues during the migration, this value should be decreased. Maximum value: database-specific value of db.default.rowPrefetchSize defined in server.properties |
|
com.heiler.ppm.audittrail.migration.server/migration.maxThreads |
Number of threads used to retrieve and process migration data from the legacy audit trail database. Dependent on the environment the migration is running, this number can be increased up to the number of CPU cores of the database server or, in case of running the migration in parallel with normal operation of the P360 system in production, it could be decreased. Default value: one half of the value for db.available.cpu configured in server.properties |
migration_template.json
In addition to the audit trail index policies and templates used for Elasticsearch in <PIM_SERVER_INSTALLATION_ROOT>\configuration\HPM\audittrail, there is a similar template that is used for audit trail migration indexes, migration_template.json. For details, please refer to the Audit Trail Configuration documentation, chapter "Index policies and templates".
Rights
There is a new action right the user must have in order to execute the migration: "Audit Trail, migration" - "Permission to start audit trail migration job"
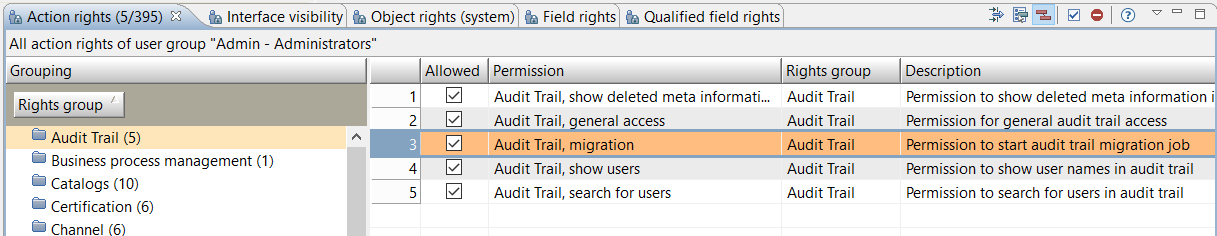
Other rights are not considered in the migration process.
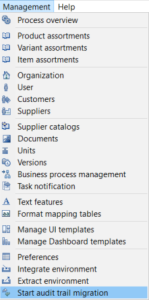
Start Migration
In order to start the migration, start the Desktop Client and open the Management menu. You will find a new entry at the bottom "Start audit trail migration".
If the entry is missing, the user probably does not have the action right.
Only one migration job can run at a time, so if the menu entry is disabled, a job instance might already be running.
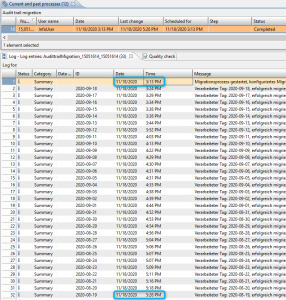
You can find the executed server job in the process overview perspective under System processes.
The problem log of the job will show the progress as well as errors.
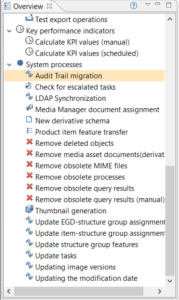
The number of migrated changes is logged for every processed day. This includes also the number of errors or skipped changes. A change will be skipped if it could not be migrated, details will also be logged, or if its entity is not configured to support audit trail.
After migration
After the migration, you can revoke the migration right from your users.
The customer won't need to start the audit trail server anymore. This also means the old audit trail database is not used anymore. If you didn't migrate all data and you are not sure if you might need the data again sometime, think about storing a backup from the database.
FAQ
Which is the best way to migrate the data?
The audit trail migration is a process that will take several days. Therefore, you should consider in advance what options you have. In general, there are two ways the migration can be done.
Parallel to normal P360 server operation
The first option is to start the migration after the P360 system has been updated. Because the migration first processes the latest data and then goes backwards in time, the data most likely to be needed is available almost immediately. It is important to be aware that not all of the system resources should be used for the migration, otherwise the P360 server will not run smoothly for your everyday tasks. To limit the system resources used, you can configure the values for the attribute migration.maxThreads and migration.fetch.size, see .AuditTrail Migration v10.1#plugin_customization.ini.
Alternatively, for a multi-server system, one of the job servers could be used exclusively for the migration. Please have a look at the priority job server feature (available since10.1.0.00.05). With this feature you can define certain jobs as priority jobs, so those will only be executed on the priority job servers.
In advance of system upgrade
The second option is to do the migration in advance of the system upgrade. For this purpose, a separate P360 system (including a copy of the database) is needed, for example the QA or test system. As the migration would be the only process running on that system, you can use all available system resources for it, see .AuditTrail Migration v10.1#plugin_customization.ini.
First step
First, you have to configure a start date, which must be a day in the past, e.g., yesterday. In this step, the new Elasticsearch indexes will be created and all data from yesterday until the migrationToDate back in the past will be migrated.
Second step
After the update of the system, the second, much smaller part of the data will be migrated using the previously created audit trail indexes. For this, the migration period must be configured correctly, which is now the current time back to the day after the start of the first part.
Example
If you want, for example, to migrate all data from the first of January 2020 until now, your first step would use
migrationFromDate = 2021-04-13 (this may be yesterday or another day in the past)
migrationToDate = 2020-01-01 (this is the date of the oldest data to migrate, all older legacy audit trail data will not be migrated).
The second step covers the day after 13rd of April until now, you would use
migrationToDate = 2021-04-14
migrationFromDate=<empty>
How long will the migration take?
An assumption on the duration can be made based on following data
number of root entity changes to be migrated totally => root_entities_total
number of root entity changes to be migrated in a time frame => root_entities_in_time_frame
duration of migration in the same time frame => time_for_migration_in_time_frame
You can determine these numbers by executing statements on the customer database and observing the migration progress on the customer system.
Step 1
Determine the number of root entity changes to be migrated totally and the number of root entity changes to be migrated in a time frame (e.g. first month). Use following statements:
-- MS SQL---- root_entities_totalSELECT COUNT(1) root_entities_total FROM EntityChange WHERE ParentEntityChangeID IS NULL ---- root_entities_in_time_frameSELECT COUNT(1) as root_entities_in_time_frame FROM EntityChange WHERE ModificationDate < '2020-09-19 00:00:00' AND ModificationDate > '2020-08-19 00:00:00' AND ParentEntityChangeID IS NULL-- Oracle---- root_entities_totalSELECT COUNT(1) FROM "EntityChange" WHERE "ParentEntityChangeID" IS NULL ---- root_entities_in_time_frameSELECT COUNT(1) FROM "EntityChange" WHERE "ModificationDate" < TO_TIMESTAMP('2020-09-19 00:00:00', 'yyyy-mm-dd HH24:MI:SS') AND "ModificationDate" > TO_TIMESTAMP('2020-08-19 00:00:00', 'yyyy-mm-dd HH24:MI:SS') AND "ParentEntityChangeID" IS NULLStep 2
Analyze the migration protocol for the same time frame as in SQL statement above and determine the duration of the migration process.
In our example it took 133 minutes.
Step 3
Determine the total duration using the following formula
time_total = root_entities_total * time_for_migration_in_time_frame/root_entities_in_time_frame
Example
In our example migration we determined following numbers:
|
Changes on |
Root entities |
Duration |
Space on disk (DB) |
Space on disk (Elasticsearch index) |
|
1 month |
1,760,830 |
133 min |
n/a |
~ 1 GB |
|
Total |
295,152,230 |
~ 15 days |
2.26 TB |
~170 GB |
There are database preparation scripts and some configuration settings available to adjust the performance and as a result the duration of the migration process. Please read the whole migration documentation and use these possibilities to adjust the migration to your needs.
Why are there so many skipped records?
If you have a look at the migration protocol you might wonder why there are so many skipped records.
![]()
As we only migrate records for audit trail enabled root entities, there might be a problem in your repository configuration. But in most cases it should be one of the following reasons:
In our standard repository, we deactivated audit trail for MediaAsset since it is mapped to the objects (e.g. item, structure group) which already record the corresponding audit trail information. That's why records for media assets themselves will not be migrated. Read more on how to activate the MediaAsset entity to support Audit Trail and migration of records.
By default, we don't log changes for User entity, that means "Last login" and "Last login with" will be skipped in the migration. Depending on user activity in the past, there could be many such records.
If you want to count the records for each entity for a specific day, you can use the following SQL statement:
-- (MSSQL) list all entities and the corresponding record count for one day, e.g. 2020-09-30 SELECT EntityName, count(EntityName) FROM EntityChange WHERE ModificationDate < '2020-10-01 00:00:00' and ModificationDate > '2020-09-30 00:00:00' AND ParentEntityChangeID is nullGROUP BY EntityName-- (Oracle) list all entities and the corresponding record count for one day, e.g. 2020-10-14 SELECT "EntityName", count("EntityName") FROM "EntityChange" WHERE "ModificationDate" < TO_TIMESTAMP('2020-10-15 00:00:00', 'yyyy-mm-dd HH24:MI:SS') AND "ModificationDate" > TO_TIMESTAMP('2020-10-14 00:00:00', 'yyyy-mm-dd HH24:MI:SS') AND "ParentEntityChangeID" is nullGROUP BY "EntityName"Has really all my data been migrated?
Our first goal in migrating the audit trail records was not to lose any data. This is not always easy because legacy audit trail data can be very different depending on the repository configuration. Sometimes they may be incomplete, or changes may have been made to the repository so that individual fields or logical keys no longer exist. For other change records the used enumeration values might not exist anymore.
So we had to consider many different cases and maybe there are some data constellations for which the displayed migrated audit trail data does not look as nice as for changes logged with the new audit trail.
But if you take a closer look at the data you will see that no information has been lost.
Examples:
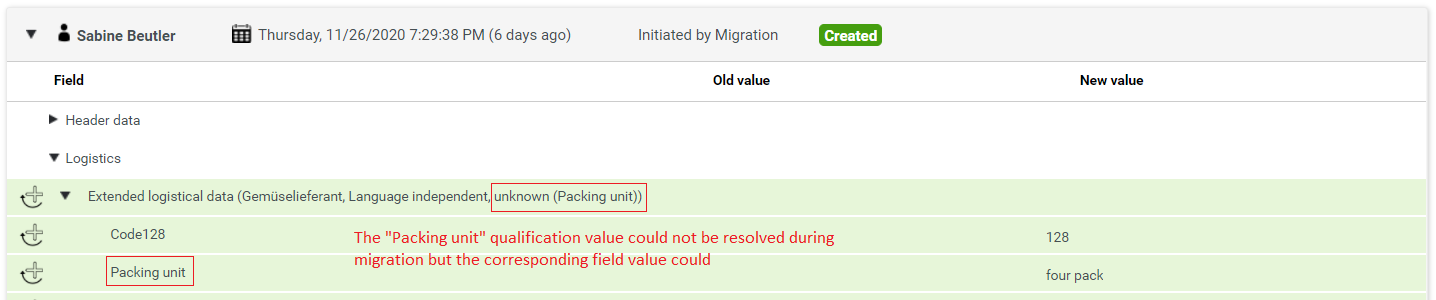
Sometimes it can happen, that values for the qualification are not available, then we try to find the corresponding field values. In this case the data is displayed like this:
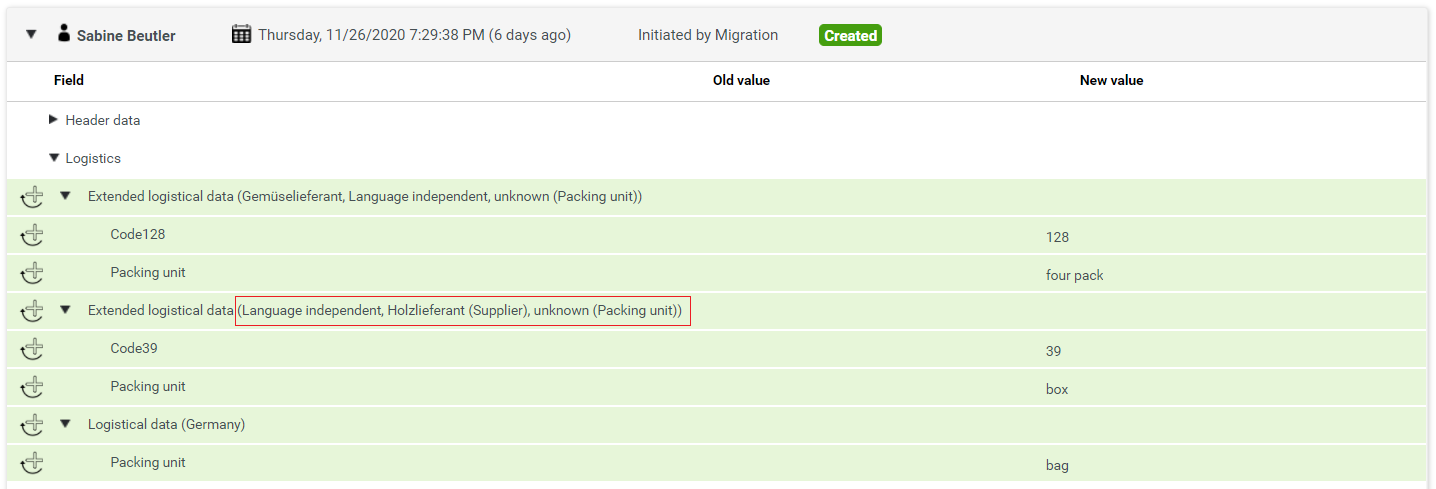
If it was not possible to resolve a logical key during migration, it will be put with its original name to the change document. In case of such non-resolved logical keys, we show the name of the logical key in addition to its value:
Troubleshooting
Re-execute migration
If something goes horribly wrong, what we - of course - don't anticipate, don't worry. The data in the old data base is not destroyed by the migration, so you can do it again. Two things are required to bring your system back to the starting point: delete the Elastic migration indexes and clean up the progress information.
Delete migrated data
In order to remove the already migrated entries from elastic you have to delete the corresponding migration indexes.
The index names follow a pattern, dependent on the settings in the repository. The migration indexes have the same names, but with the suffix '_migrate', e.g.
Changes of products of the Master catalog are stored in <system_name>.audit_product2g_master_migrate
Changes of items of supplier catalogs are stored in <system_name>.audit_article_supplier_migrate
Changes of other objects are usually stored in <system_name>.audit_longterm_main_migrate
You can find the system name in the server.properties file.
To delete the indexes, either use an interface for elastic like kibana or use the following commands:
DELETE /<index>Related CURL commands are:
curl -X DELETE server:port/<index>To find out related indices in Elasticsearch you can use:
curl -X GET "server:port/_cat/indices?pretty" -u userYou have to replace: server, port and user with Elasticsearch URL and credentials.
For further information see Elasticsearch Delete index API.
Don't remove any of the index templates associated with Product 360
Delete progress information
Finally, remove the progress.json file from the subfolder audittrailMigration of the configured shared folder and you can try again. The P360 server doesn't need to be restarted.
Increase trace level
There is also a possibility to increase the trace level for the audit trail migration job to see more information about records migrated with warnings in the migration protocol displayed in the "Process overview" perspective. By default, only errors will be logged.
Enable the logging of migration warnings in the log4j2.xml file. Be aware of very technical information which will be logged, and use this trace level carefully.
<Logger name="AT_MIGRATION" level="DEBUG" />Configure system resources used
Decreasing the memory usage
There is a possibility to decrease the memory consumption of the audit trail migration process by adjusting the value of com.heiler.ppm.audittrail.migration.server/migration.fetch.size, see .AuditTrail Migration v10.1#plugin_customization.ini.
Please note that the time of migration will increase, if you decrease the fetch size.
Decreasing the number of threads
Retrieving and processing migration data from the old audit trail database is the crucial part of the audit trail migration process, so all available CPU cores on the audit trail migration server are used by default. If the audit trail migration is running in parallel with a running P360 system on the same machine, the number of threads used by the migration must be limited to ensure fluid use of the P360 system.
This can be done by changing the property com.heiler.ppm.audittrail.migration.server/migration.maxThreads, see .AuditTrail Migration v10.1#plugin_customization.ini.
Elasticsearch exceptions
When working with Elasticsearch, you are likely to get errors from time to time. Elasticsearch provides detailed documentation, there is also a large community with a huge amount of knowledge. Therefore, while we briefly list the most common errors here, we strongly recommend that you read this documentation for further details and problems not listed here.
Adjustments of elastic settings (Exception: 'Unable to parse response body')
There can be huge change documents created and stored in Elasticsearch, e.g. during migration of changes made by import or merge.
To avoid HTTP/1.1 413 Request Entity Too Large errors that are logged to the migration protocol as "Exception during migration: Unable to parse response body" errors, add and adjust the setting http.max_content_length in the Elasticsearch configuration. The default value is 100MB which might not be enough for some migration cases.
Please note: Before you make any changes, you should always read the Elasticsearch Installation documentation.
If PIM runs in a hosted environment like AWS, an AWS ES limitation can cause such issue. e.g. m5.large.elasticsearch instance has a Maximum Size of HTTP Request Payloads of 10MB. That may be not enough for any audit trail migration request to Elasticsearch.
See 'Network limits' in https://docs.aws.amazon.com/elasticsearch-service/latest/developerguide/aes-limits.html
Elasticsearch Exception (type=circuit_breaking_exception)
If the audit trail migration stops with an Elasticsearch exception with type=circuit_breaking_exception and reason=Data too large, data for [<http_request>] ...
then the memory settings (-Xmx) in Elasticsearch config/jvm.options file is too low.
Please note, if the memory for Xmx is > 1GB and you are using JDK8 on windows, then you should use an odd number (1, 3, 5... GB) as value (https://github.com/elastic/elasticsearch/issues/47384#issuecomment-543952442).
Elasticsearch Exception (type=illegal_argument_exception)
If the audit trail migration stops with an Elasticsearch exception with type=illegal_argument_exception and reason=all shards failed,
please look for any nested exceptions. If the nested exception is also an Elasticsearch exception with type=search_phase_execution_exception, please have a look to the section below.
Elasticsearch Exception (type=search_phase_execution_exception)
If the audit trail migration stops with an Elasticsearch exception with type=search_phase_execution_exception and reason=Result window is too large, from + size must be less than or equal to ...
then the Elasticsearch setting max_result_window has to be increased.
The maximum number of search results for an index is limited to 10000 by default. We recommend to use 50000 for this property. But be careful, search requests take heap memory and time proportional to max_result_window value, so it should not be increased too much.
You can change the value for the corresponding index directly, for example using Kibana (Management → Index Management → Edit settings) or by using the update index settings API of Elasticsearch (see https://www.elastic.co/guide/en/elasticsearch/reference/current/indices-update-settings.html).
Correct object identifier
If you have started the audit trail data migration with a version before 10.1.0.00.06, the object identifiers of migrated data are different from those of the data changed (by a user) in the new audit trail.
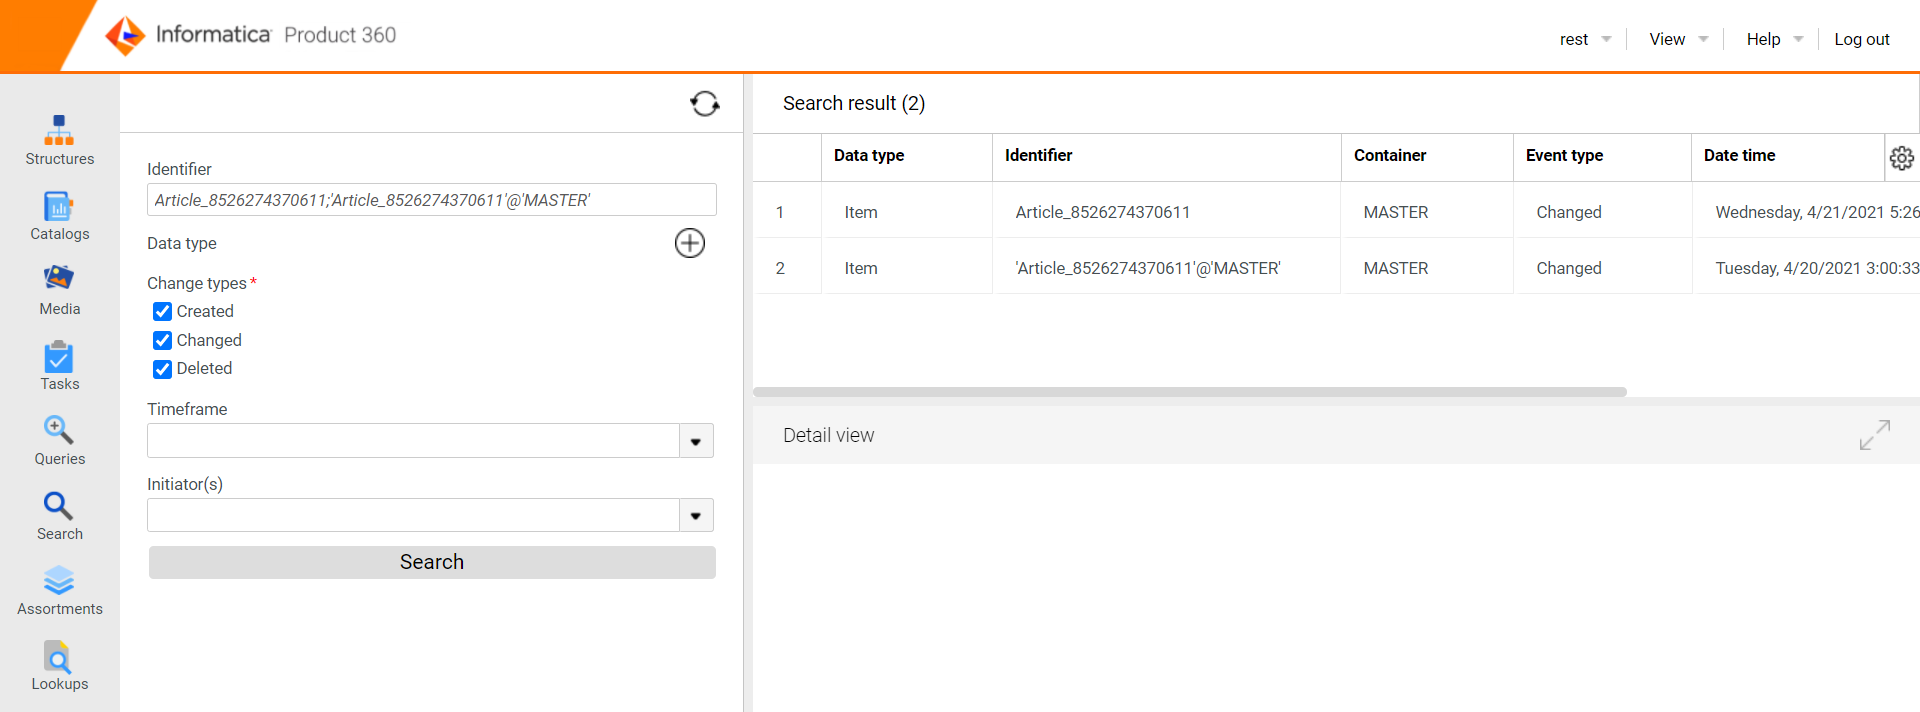
Most likely, rerunning the audit trail data migration is not an option. Therefore we provide a fix to update all affected object identifiers in the elasticsearch migration indexes. This update is optional.
We have integrated that update into the Database Setup Client. Note that this update will not be executed when you start a regular database update.
Preparation
During the database setup you specify a server.properties file. This usually is the one you use for your sever.
However, if you want to update the object identifiers in the audit trail migration indexes, you have to prepare a special server.properties file. The best way is to copy the original server.properties file and adjust it.
The following changes will cause the Database Setup Client to run in "single version only" mode, which means that only one database update will be processed. If it is finished successfully, the corresponding version will be written to the database so that the same update script will not run a second time. (As this update is optional, your server will startup without the update as well.)
Add the following lines to your copy of the server.properties file:
For MS SQL Server
db.update.only.schema = MAIN
db.update.only.version = 794
For Oracle
db.update.only.schema = MAIN
db.update.only.version = 795
Starting the database setup
Now you can start the Database Setup Client and choose the adjusted server.properties file.
Logging
By default the logging will only tell you that the update is executed.
You can get more information if you adjust the settings in the log4j2.xml file of the Database Setup Client by setting the log level to DEBUG:
<Logger name="com.heiler.ppm.dbsetup.core.auditTrailIdentifier" level="DEBUG" />The log will contain the names of the indexes that were found, the number of processed documents and the task id of the task updating the documents in elasticsearch.
If you want to get more information about the progress of the update, you can activate the performance log:
<Logger name="com.heiler.ppm.dbsetup.core.PERF" level="DEBUG" />In this mode, a log entry will be written every five minutes that provides information about the number of documents that have already been processed.
Index '<systemName>.audit_article_master_migrate', updated: 7529000/27830242, not touched documents: 0, duration: 1:00:30.828Whenever elasticsearch has finished processing a single index, you will see a summary in the log as well.
Further information
Please note that the duration of the update depends on the number of documents in the migration indexes. For our tests we found that 100000 documents take around one minute to be processed. The overall time of the update is determined by the biggest index because all indexes are processed in parallel.
Not touched documents mean these documents match our query for the update but couldn't be processed by the script to correct the identifier because it is something really unusual we cannot handle (e.g 'item'@'123'@'MASTER'). These identifiers won't be changed.
Technical details
For developers, there is a way to further enhance the log. Set com.heiler.ppm.dbsetup.core.PERF to log level TRACE.
For the index updates this will add the average duration for 100000 documents. For the finish summary of each index it will add the average duration of 100000 processed documents as well as the number of updated and not touched documents. Note that for technical reasons the number of updated documents in the finish summary is the number from the last update, not the total number of processed documents.
You can use the Kibana Console to execute the following REST request to see the status of the tasks in elasticsearch:
GET _tasks?actions=*byquery&detailedWhy does my data look strange?
Some customers might see migrated data in the History tab that looks different from data that has been changed by a user in the UI after the migration. This section should give you an idea why that happens and how you can fix it by configuring your repository differently.
Let's have a look at an example. This is the changed data when it has been changed in the UI in the new P360 version (without migration):
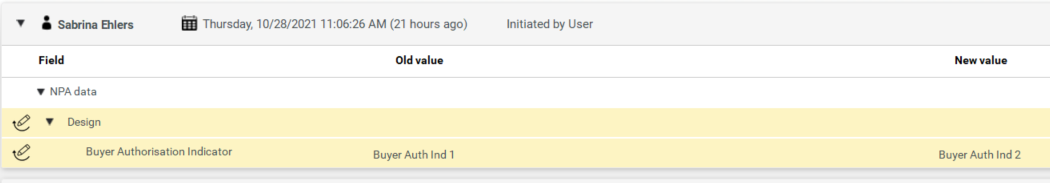
This, however, is the the same changed field when it has been migrated:

The big difference is in the logical keys. In the first picture no logical keys or their values are shown. This is because they are all not editable. We would expect the same for the migrated data but in the migrated data we see the values for the logical keys followed by the display name of the respective logical key.
Why?
During the migration the data that's found in the old Audit Trail database is transformed in a json document. This json document contains a 'qualification' section that uses the short identifier to identify a logical key. Therefore the logical key (and its field) has to be found in the repository during migration. In this case the short identifier wasn't found. Instead the display name was written in the json document and the UI has no chance to find out information like visibility or editability and therefore simply shows what it found in the json document.
How can it be fixed?
It can be fixed by some changes or adjustments in the repository.
Add fields belonging to logical keys
Check if there is a field that belongs to the logical key and if not add it.
The short identifier is retrieved from the field that belongs to the logical key. If it doesn't exist, it won't work correctly.
In order to find out which field type your new field needs to have, find the logical key type in the types area and in the properties have a look at 'Field Type'. The logical key and the field must have the same short identifier.
After you added the fields, it may look something like this: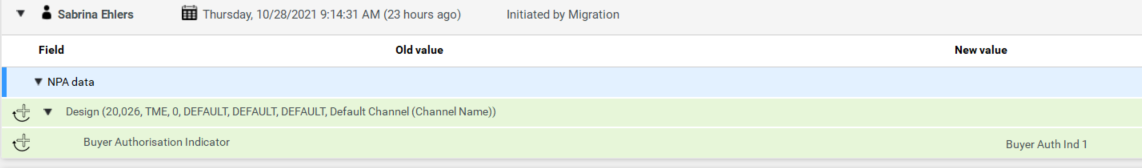
Make values convertible
'Default Channel (Channel Name)' still doesn't look as expected. This is because the value couldn't be converted properly. The field does not have an enumeration. Setting an enumeration should fix this. If no enumeration is availabe but the value is an EntityProxy, make sure that the 'Proxy Transition Entity' is set.
Adjust visibility
The logical key values are still visible. This can be fixed with repository settings as well.
When is a logical key value visible? They are not visible when they haven't been migrated. This means they are not part of the json document in elastic search.
This is also defined by the field belonging to the logical key.
The logical key is skipped during the migration if
the fields 'Supports Audit Trail' is set to false
the fields short identifier is empty
the field is set to visible = false, editable = false and the logical key is set to editable = false
Now the migrated data and changes that are made later look the same in the History tab.
Limitations
Because in the old Audit Trail some data hasn't been stored that is available in the new Audit Trail, there are some limitations to the migrated changes
Attribute and Characteristic values are not formatted according to their data type (which is a capability introduced with the new Audit Trail)
Changes of characteristic values are missing the characteristic hierarchy to which they belong (which is a capability introduced with the new Audit Trail)