Debugging Remote Processes Running on the Server
As described in Deploying Your Processes, you can run your BPEL processes on A Process Server. You can connect to a running, suspended, completed, or faulted process from within Process Developer for remote debugging.
When the process instance is opened in Process Developer, you have full access to the debug features you use during simulation, such as setting a breakpoint, stepping or running to a breakpoint, following highlights along the execution path, and inspecting process variables. You can also modify data values and retry activities.
Before you can debug a process remotely, you must complete the following:
- •Create and validate a BPEL process
- •Create a process deployment descriptor file
- •Create a business process archive
- •Deploy the business process archive to the Process Server
- •Keep a copy of the BPEL and WSDL files in your workspace project
- •Start the server
- •Instantiate the process by sending an appropriate message to it
Configuring a Remote Process Connection (on-premises only)
Set up a configuration to indicate where processes are running and how you want to attach to them.
As a first step in remote debugging, you must set up a configuration to indicate where processes are running and how you want to attach to them.
- 1. From the Run menu, select Debug Configurations.
- 2. In the Debug Configurations dialog, select Remote Process, and then select New.
- 3. In the Name field, you can change the default configuration name, if desired, to make it more meaningful. This is useful if you set up multiple configurations to various servers or for various authenticated users.
- 4. In the Main tab, the default Server URL is displayed for the Process Developer engine embedded with Process Developer. Modify this URL if you want to point to the Process Developer engine in another location or to a different Process Server.
- 5. In the Process Selection panel, select what processes you want to debug, and refer to Selecting Processes for Remote Debugging for details.
Manual process selection or breakpoints | A list of attached processes appears in the Debug view, and you can right-mouse click on the process to connect to it. |
Prompt for process selection from list | When you select Debug, a dialog box appears displaying running or completed processes available for debugging |
Stop on next process instance creation | When you select Debug, a "Waiting" message appears until a process instance is created for any deployed process. Once the process is instantiated, the local copy of the process opens in the Process Editor for debugging. Refer to Options Tab below to hide the waiting message for the current debug configuration and to Remote Debugging Preferences to hide the waiting message for all processes. |
- 6. In the Process location field, type in a process name, if desired. Only processes of this name are attached to during instance creation and are used as the default filter for process lists.
If desired, you can type in the qualified name, enclosing the namespace in curly braces, as shown in the example. By using the qualified name, you can pinpoint processes of similar names using different namespaces.
- 7. Enable the option Attach to any process on breakpoint, if desired, to indicate that any local copy of a process containing a breakpoint is attached to, if not already attached, when a breakpoint is hit.
Do not enable this option for processes running on a high volume server. Remote debugging can impact performance.
Authentication Tab
- 1. Select one of the following:
- - No credentials required. No username and password are required to access the Process Server.
- - Always prompt for credentials when connecting. Prompt for username and password when beginning a remote debug session for a running process on Process Server.
- - Use supplied credentials when connecting. Use the Username and Password filled in below when connecting to the Process Server.
- 2. Enter a Username and Password, if required, for the Server URL.
Options Tab
You can select options for a particular debug configuration that override the default settings listed in Preferences. Preferences are located in
Window > Preferences > Process Developer > Remote Debug. For details on the default settings, see
Remote Debugging Preferences.
Common Tab
- 1. Select the Common tab.
- 2. Modify the following defaults, if desired:
- - Local or Shared File. You can select Shared and then save the currently named configuration to a workspace folder to share it. The configuration settings are added to an XML file named configuration_name.launch.
- - Display in Favorites menu. By default the Debug and Run icons are displayed on the Process Developer toolbar.
- - Standard Input and Output. By default, input is displayed on the Console, and you can also send output to a file.
Starting a Debug Session
Select one of the following to start or delay a remote debug session.
- •Select Apply to save this configuration and continue creating another configuration
- •If the server is running, select Debug to save and begin remote debugging for the current configuration
- •If the server is not running, select Close. The configuration is saved, and you can run it from the Debug As list in the main toolbar.
Selecting Processes for Remote Debugging
Select a process by picking from the list, typing in an ID, or typing in a name. The list shows running processes. You can select All, Completed, or Faulted from the drop-down list.
When you create a configuration for attaching to remote processes, as described in
Configuring a Remote Process Connection (on-premises only), you can select how you want to attach to a process.
Here are some details on each selection type.
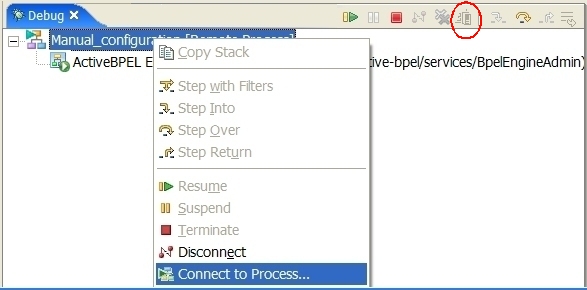
Manual process selection or breakpoints
You can set up a launch configuration and then connect to a process to debug it. As the example shows, select Connect to Process from the launch configuration, or from the Debug toolbar (the launch configuration must be selected to add focus to the toolbar). The Select Process dialog displays.
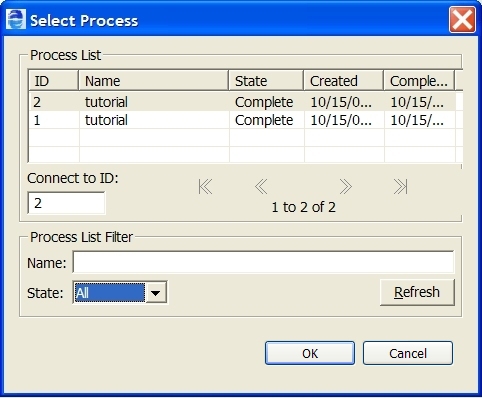
Select process by Id or from a list
When you start up debugging, by selecting Debug in the Debug dialog, the Select Process dialog appears, as shown in the example.
By default, the Process List displays running processes. To make other selections, do one of the following:
- •Select a process from the list or type an ID in the Connect to ID box.
- •Select process instances of a process by typing a name in the Name field and selecting Refresh.
- •Select All, Running, Complete, Faulted, Suspended, or Compensatable from the State menu
The
Select Process dialog can display the namespace plus the process name, if desired. For details, see
Remote Debugging Preferences.
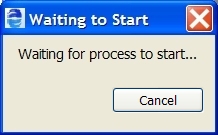
Stop on next process instance creation
When you start up debugging, the following dialog can appear, if you set a preference to show it.
When any deployed process is instantiated, the local copy of it in your workspace is opened in the Process Editor. The process is suspended at the initial activity. You can run through or step through the process.
You can set a preference to show/hide the Waiting to
Start dialog. For details, see
Remote Debugging Preferences.
Setting Breakpoints on a Process for Remote Debugging
You can set a breakpoint on any process. Set the breakpoint on your workspace copy of the process. You do not need to deploy a process with breakpoints set. For more information, see
Running to a Breakpoint in a BPEL Process.
You can attach to any running process on breakpoint by enabling an option in the Debug dialog. With this option enabled, all workspace copies of your processes are scanned to see if any breakpoints are set. Process Developer connects to any running process when a breakpoint is hit and begins a remote debug session.
Using the Debug View Process Editor and Variable View for Remote Debugging
Using the Debug View, Process Editor, and Variable View for Remote Debugging
In remote debugging, the debug target is the remote process engine. The debug target contains multiple processes that were attached to for debugging.
When you attach to a process, it is suspended by the debug target until you resume or step the process.
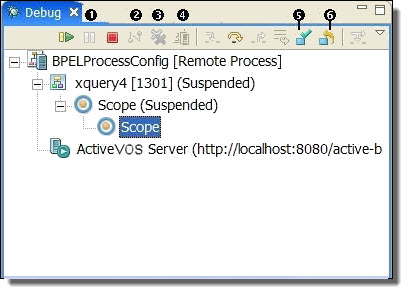
In the Debug View, you can suspend, disconnect, and terminate all threads. In addition, you can use tools to make corrections in faulting activities, as shown in the illustration.
1 | Suspend | Suspends the selected running process |
2 | Disconnect | Disconnects from the remote server resuming any processes that were suspended |
3 | Remove All | Removes all terminated processes |
4 | Connect to Process | Set up a launch configuration and then connect to a process |
5 | Complete Activity | Complete an activity without executing it. For details see Correcting, Retrying, or Completing Activities. |
6 | Retry Activity | Retry execution of an activity. For details see Correcting, Retrying, or Completing Activities. |
Once a process is attached, Process Developer automatically opens the workspace copy of it in the Process Editor. The Process Editor shows the state of the attached process instance, in the same way as it does for simulation as the example shows.
The Process Variables view is automatically updated to follow the instance data of the selected process.
Remote Debugging Preferences
Set remote debugging preferences for process selection.
You can set remote debugging preferences as follows:
- 1. From the Window menu, select Preferences.
- 2. Select Process Developer > Remote Debug.
- 3. Set preferences for:
- - Process List Limit. Set the number of processes to view in the Select Process dialog. This dialog appears when you want to be prompted for a process to debug.
- - Show qualified process names. Enable this setting to view the process name qualified by a namespace. The process name is displayed in the Select Process dialog. If you have two similar process names from different namespaces, this option helps you select the correct process.
- - Show Waiting to Start dialog. When you want to debug the next process instance that occurs, the Waiting for Process dialog appears. Enable this setting to show the dialog. When the next process is instantiated, the local copy of the process appears in the Process Editor and is suspended in the Debug view.
- - Disconnect launch when last connected process terminates. Enable this checkbox to automatically disconnect the launch and server when the last executing process terminates. If you leave the checkbox blank, you can select the Disconnect icon on the Debug view toolbar for each launch.
- - Check for out of sync process definition when connecting. Enable this setting to check that the BPEL process definition on the server matches the BPEL process definition in your Project Explorer view. The process you want to debug remotely can be an older or newer version than the process in your workspace. During remote debugging, Process Developer uses your workspace copy of the process and the actual instance data from the server to perform debugging. This means the workspace copy of the process should be identical to what is running on the server. It is recommended that you leave this option checked. If a process is out of sync, Process Developer displays an error message during remote debugging.
- - On disconnect of suspended process. Select whether you want to be prompted, resume running the process, or take no action.
Selecting a Launch Configuration from the Toolbar
You can select a named debug configuration from the toolbar. You can use this shortcut to start a remote debugging session. The Debug picklist shows connection configurations, as the example shows.
Checking for an Out-of-Sync Process
If this invoke activity is defined with a BPEL process, you can step into it during simulation. Select a different process to synchronize with the process deployed to the server.
You can set a Remote Debug preference to check for an out of sync process definition. This means that Process Developer checks that your local copy of the process matches the server copy when connecting to the server.
During remote debugging, Process Developer uses your workspace copy of the process and the actual instance data from the server to perform debugging. The workspace copy of the process should be identical to what is running on the server.
However, if the process definitions do not match, you can perform remote debugging anyway, and Process Developer does its best to step through the activities.
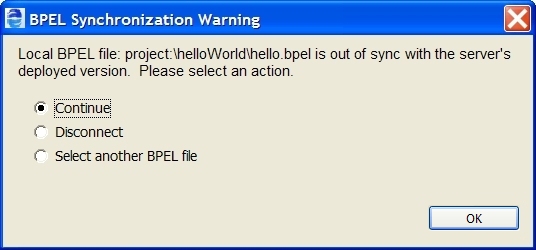
With the preference enabled, if the server copy and the local copy of your process are out of sync, Process Developer give you an option to choose another process, cancel, or continue to starting remote debugging, as the illustration shows.
You can ignore the warning and continue to debug or select another process definition.
If you disable the out of sync option, remote debugging begins, but an error messages is displayed when the mismatch is reached.
Server Interactions During a Remote Debugging Session
During remote debugging, the following occurs:
- •When you suspend a process, the process is suspended on the server
- •When you step the process, the process resumes on the server
- •When you terminate the process, the process terminates on the server
- •When you change data values, they are changed on the server
- •The Console shows processing steps
For more information about Console output, see
Setting Options for Console Output.
Setting Options for Console Output
When a remote debug session attaches to a process manually, or by connecting on a breakpoint, some event logging for that process may have already taken place in the Process Server. If so, that log is sent to the remote debug target and displayed in the Console view. If logging is turned off in the engine, no log exists, and the message "Preceding events for this process are not available" appears, followed by individual events, logged as they are received by the debugger from the engine.
For more information regarding setting logging options, refer to the Process Server documentation.