Control Center Manual
Prerequisite
In order to get the Control Center running you need to follow the installation manual for the Server Installation
Function
The Control Center is a central application to help to administrate the systems of your cluster. It provides basic functionality like:
Install and update your Product 360 system in the cluster
Start server(s)
Stop servers(s)
See logs
See running jobs
See information of servers
Gather configuration settings of the system
Shutdown clients
Send message to clients
create thread dumps
Login
To open the web interface of the Product 360 Control Center you have to know where the service is running. The URL consists of the host name and the port which is defined in the ClusterixConfig.xml. By default the port is 9000. So when the service is running on the instance called myComputer then you can open the web interface by calling myComputer:9000
The login credentials are also defined in the file ClusterixConfig.xml. By default you can login with user:clusterix password:clusterix.
Dashboard
Widget creation using templates
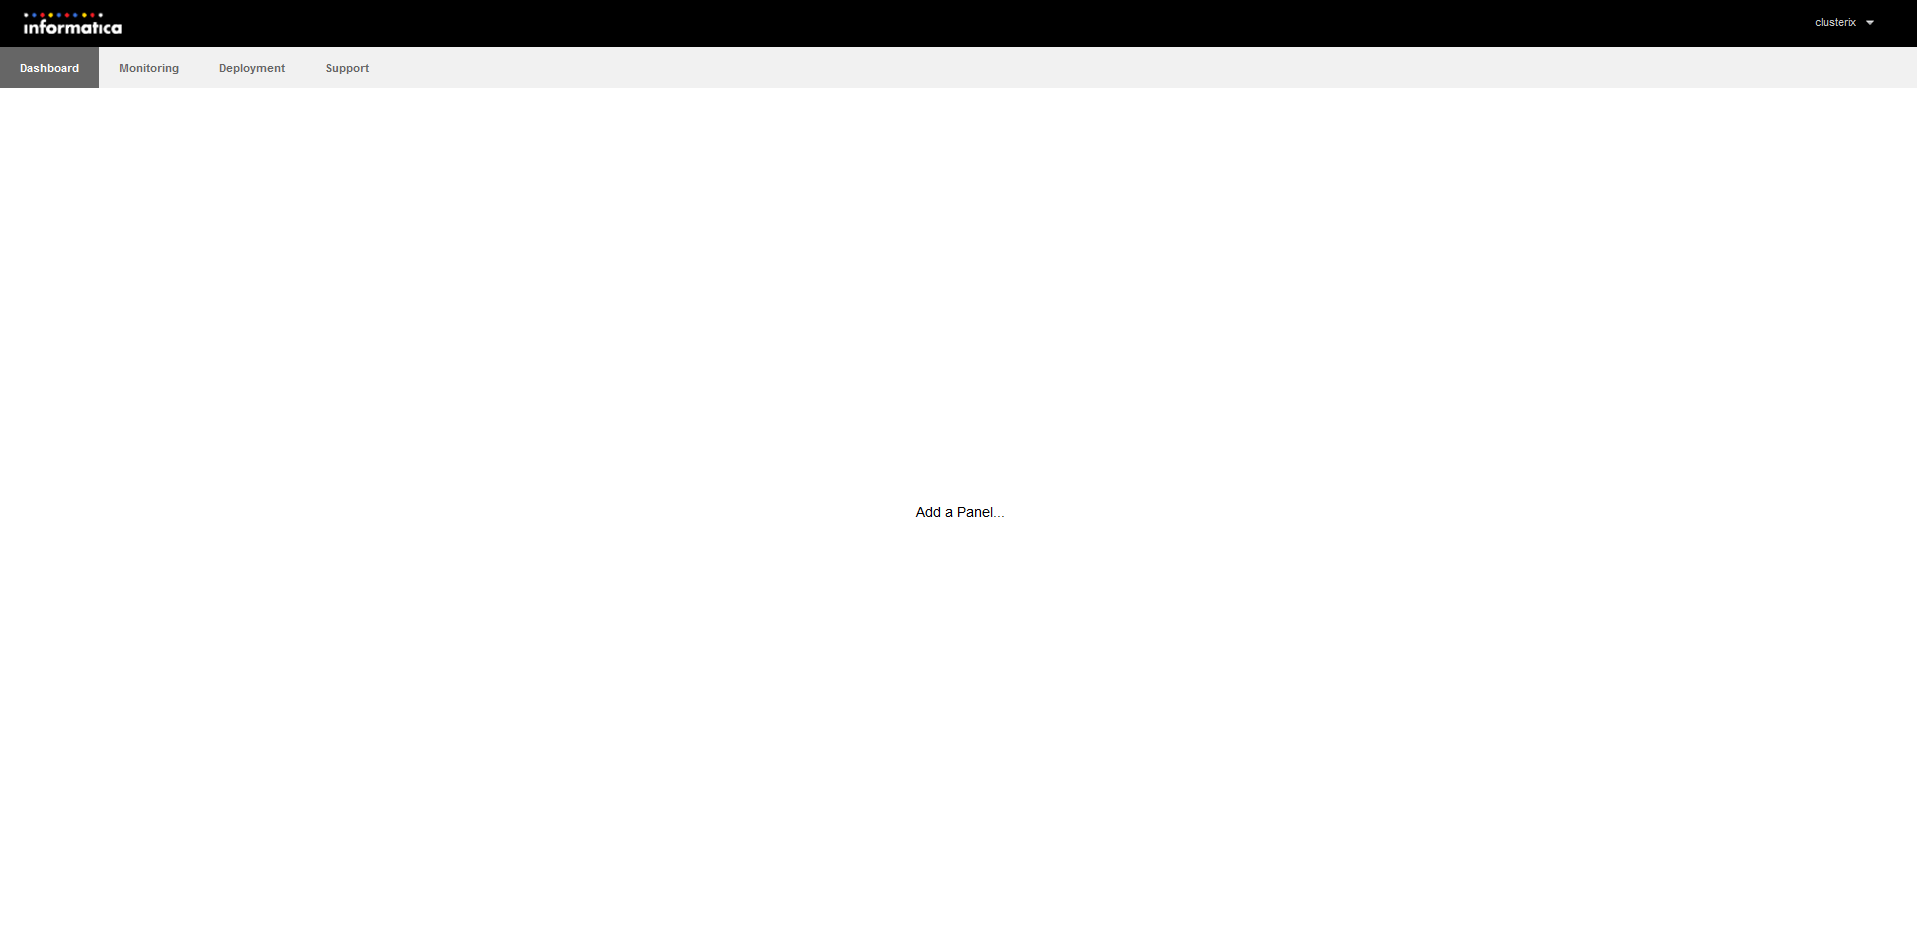
The dashboard is your personal area, where you can pint and save graphical widgets. It allows you to monitore data of a selected server. There are a number of widgets which may help you doing so. If you enter your dashboard the first time, you will be greeted with an empty panel. To add widgets to your dashboard, you can either select the label in the middel of the screen or left click on the dashboard tab in the top left corner.
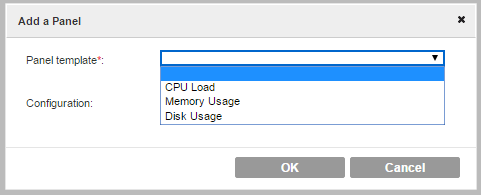
Doing so opens up a window, giving you the opportunity to add your desired panel. Selecting your wanted panel template and left cliking on the 'ok' button, places the selected widget on your dashboard.
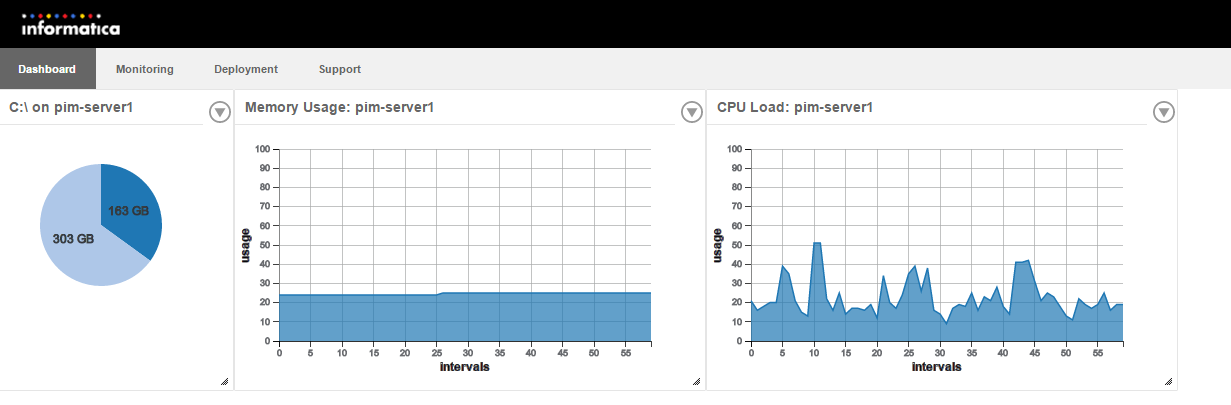
Customize widgets
The dashboard saves your current state and allows you to view your data at any given moment.
To customize your personal dashboard, you can select the arrow symbol in the top right corner of every single widget. Doing so allows you to:
select a server that you want to monitore
edit the panel itself
remove the wanted widget.
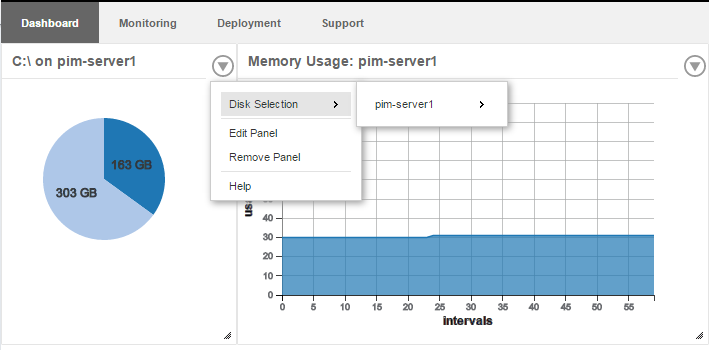
Every change will be saved once you leave your dashboard and is loaded up when you enter it, making it your own personal dashboard.
Note: The Memory Usage widget displays the total Memory available to the Java Runtime Environment and the currently allocated Memory available to current and future objects inside this environment at the given point in time of the selected Server Application. It does not show how much memory is available to the selected Server Machine itself.
Monitoring
The Monitoring tab allows you to monitor all systems inside your network. From here on out you are able to watch different categories of all apllication servers that are currently available in you network system. The left side of the monitoring tab contains a navigation tree, which is displaying the network itself and all available features for each server as nodes. The right side contains all associated data of the selected node inside the navigation tree.
Application Server Node
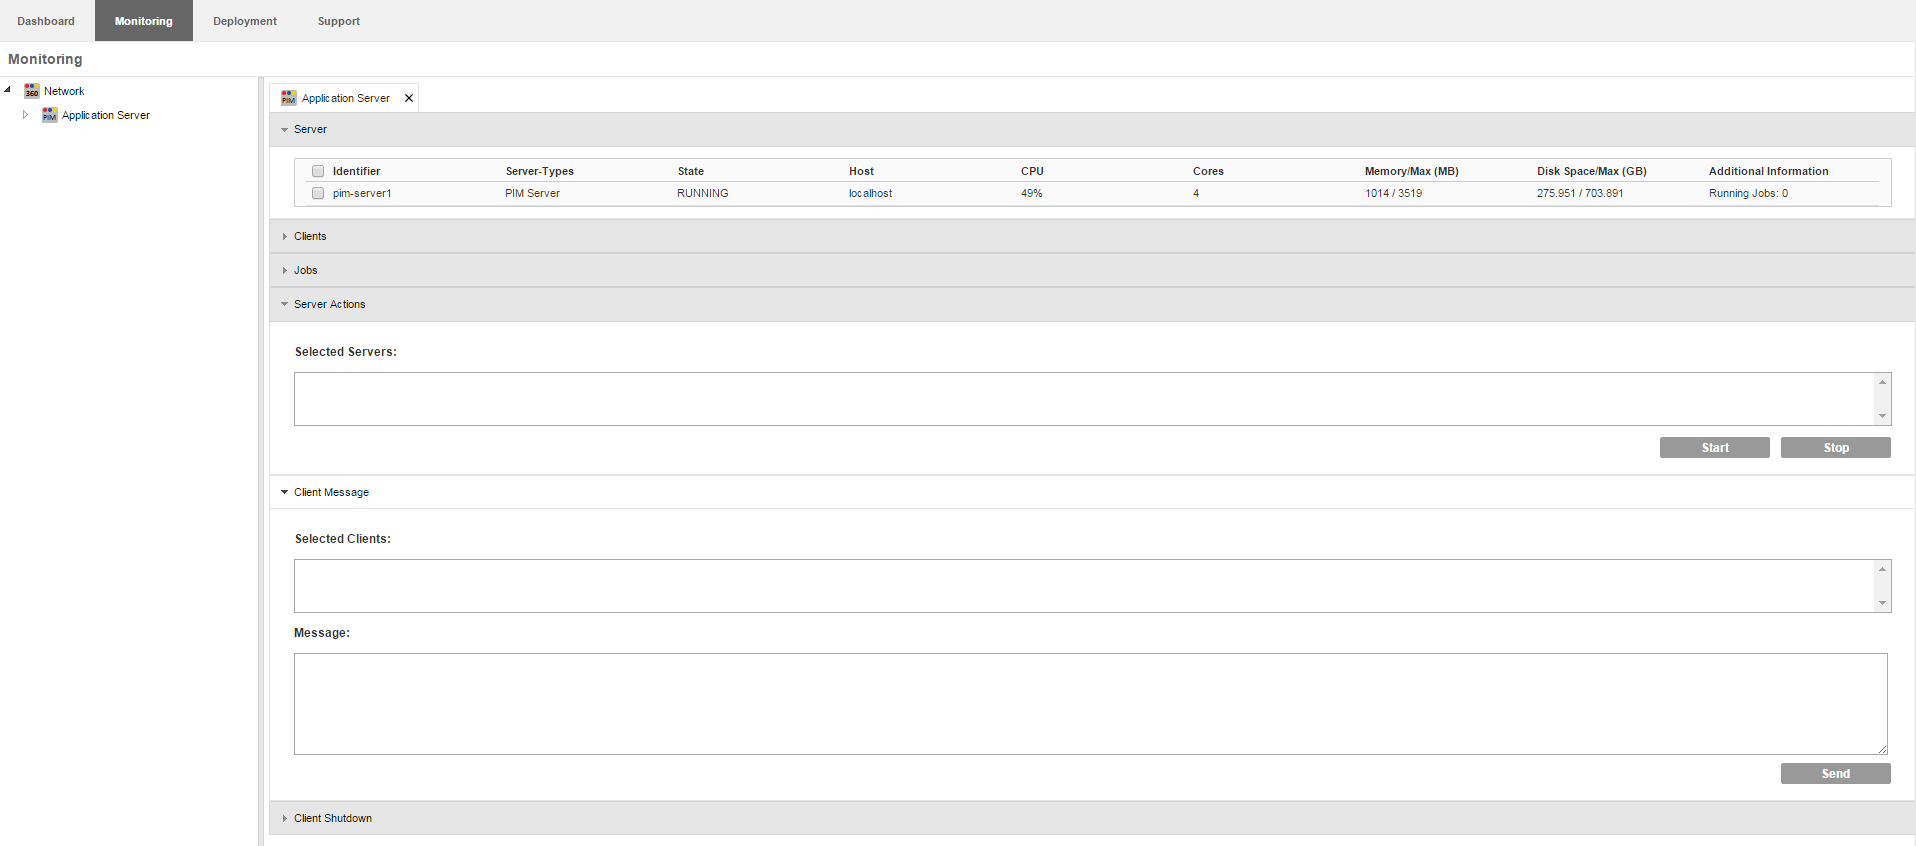
Clicking on the Application Server tab, opens the application server view. This tab contains information like:
All running application servers and their status
All connected clients
All running Jobs that are currently running on the servers
You are also able to select a running server and start or stop it. If there are clients connected to a server, you can select a client from the Client Message tab and send them a message. In the Client Shutdown tab you are able to select a client and shut it down.
Server tab
The Server tab presents server data about every configured server inside the current network. Together with the general data, which can be seen in the graphic above, you can view the current memory consumption of each server. The shown memory consumption describes how much memory has been allocated to the PIM server application running on the system and how much that application is currently using. The allocated memory on each server application can increase automatically if the application finds it necessary. This depends on how much free physical memory is available on the system and if the application is in need of more memory.
The example above has a system 'pim-server1' with a certain amount of physical memory. Currently about 3.5 GB memory has been allocated to the application. The application itself is using about 1.7 GB memory of the allocated 3.5GB memory. An external system monitor like Windows Task manager, may show a memory usage of 3.5GB as this is the memory reserved for the application.
Server Nodes
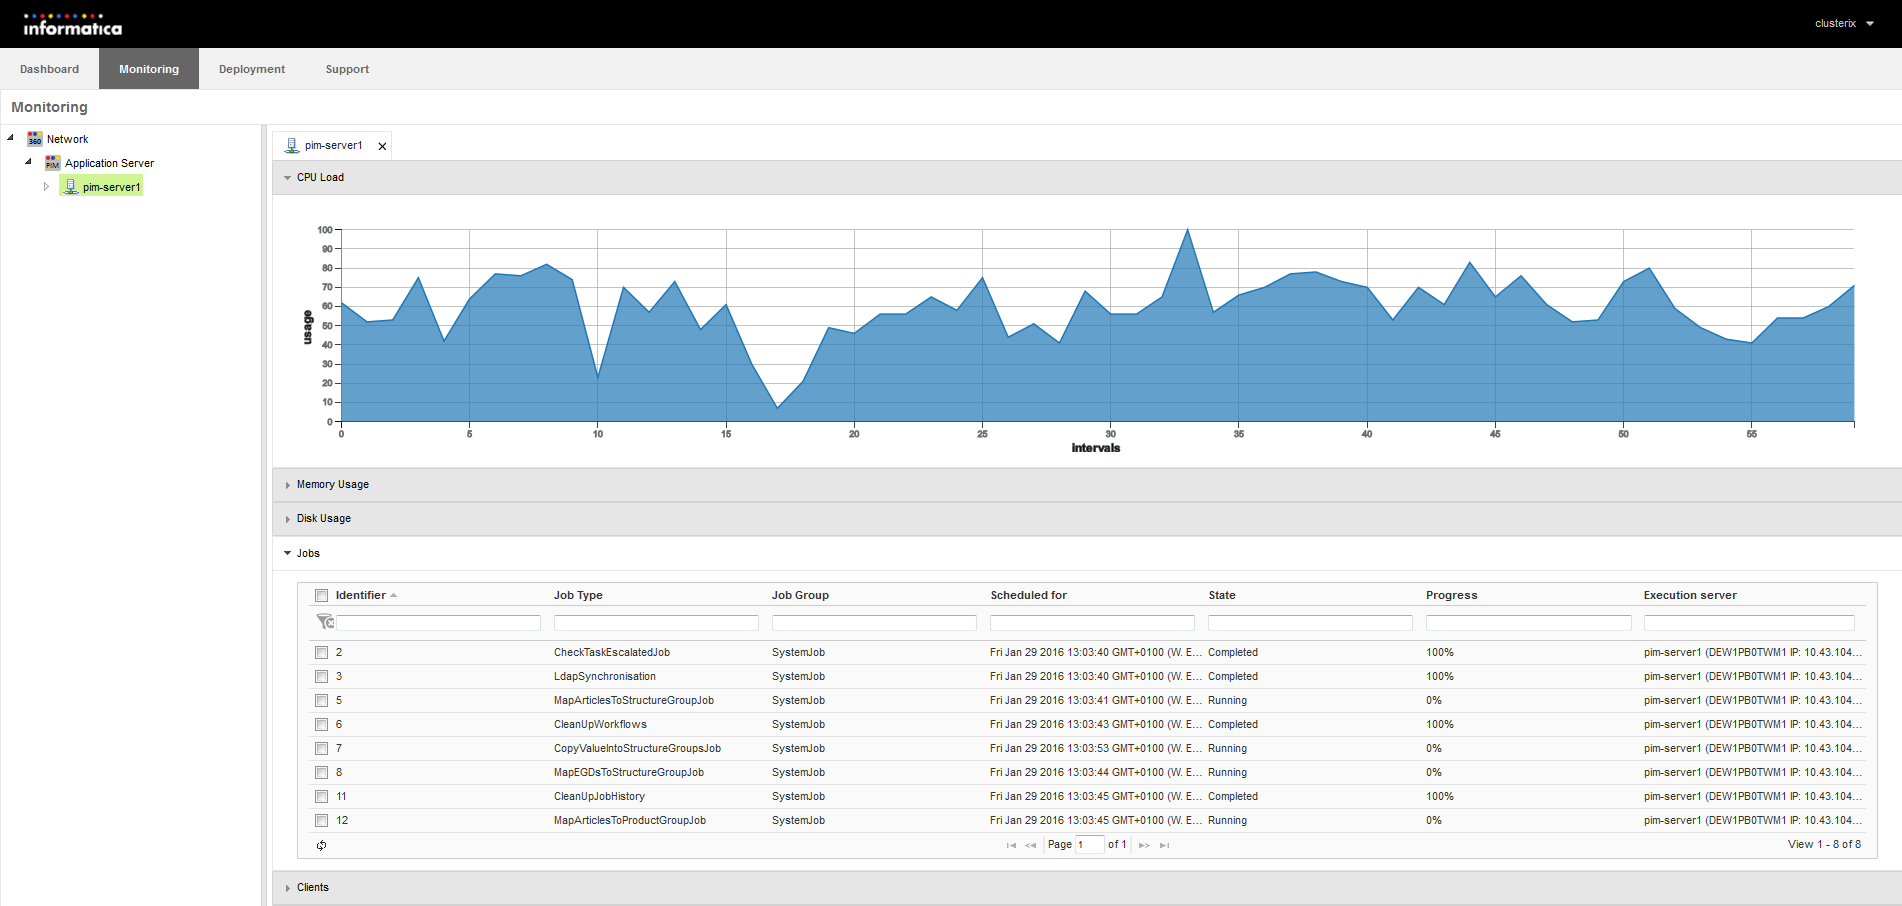
By opening the application server list and left clicking on one of your running servers inside the navigation tree, you open up a detailed view of the selected server. From here on out you have a wide variety of options and can view the following data:
A statistical view of the CPU load of the currently selected server
A statistical view of the Memory Usage of the currently selected server
A statistical view of the Disk Usage of the currently selected server
A list of all currently running jobs and their status of the selected server
A list of connected clients to the currently selected server
Just like before, you can start and stop the selected server inside the Server Actions tab.
Note: The Memory Usage Tab shows how much Memory has been given to the associated Application of a Server and how much is currently in use by the Application itself.
Server Node Details
Extending the selected server node, gives you the option to have a detailed look at the servers actions and data.
Clients
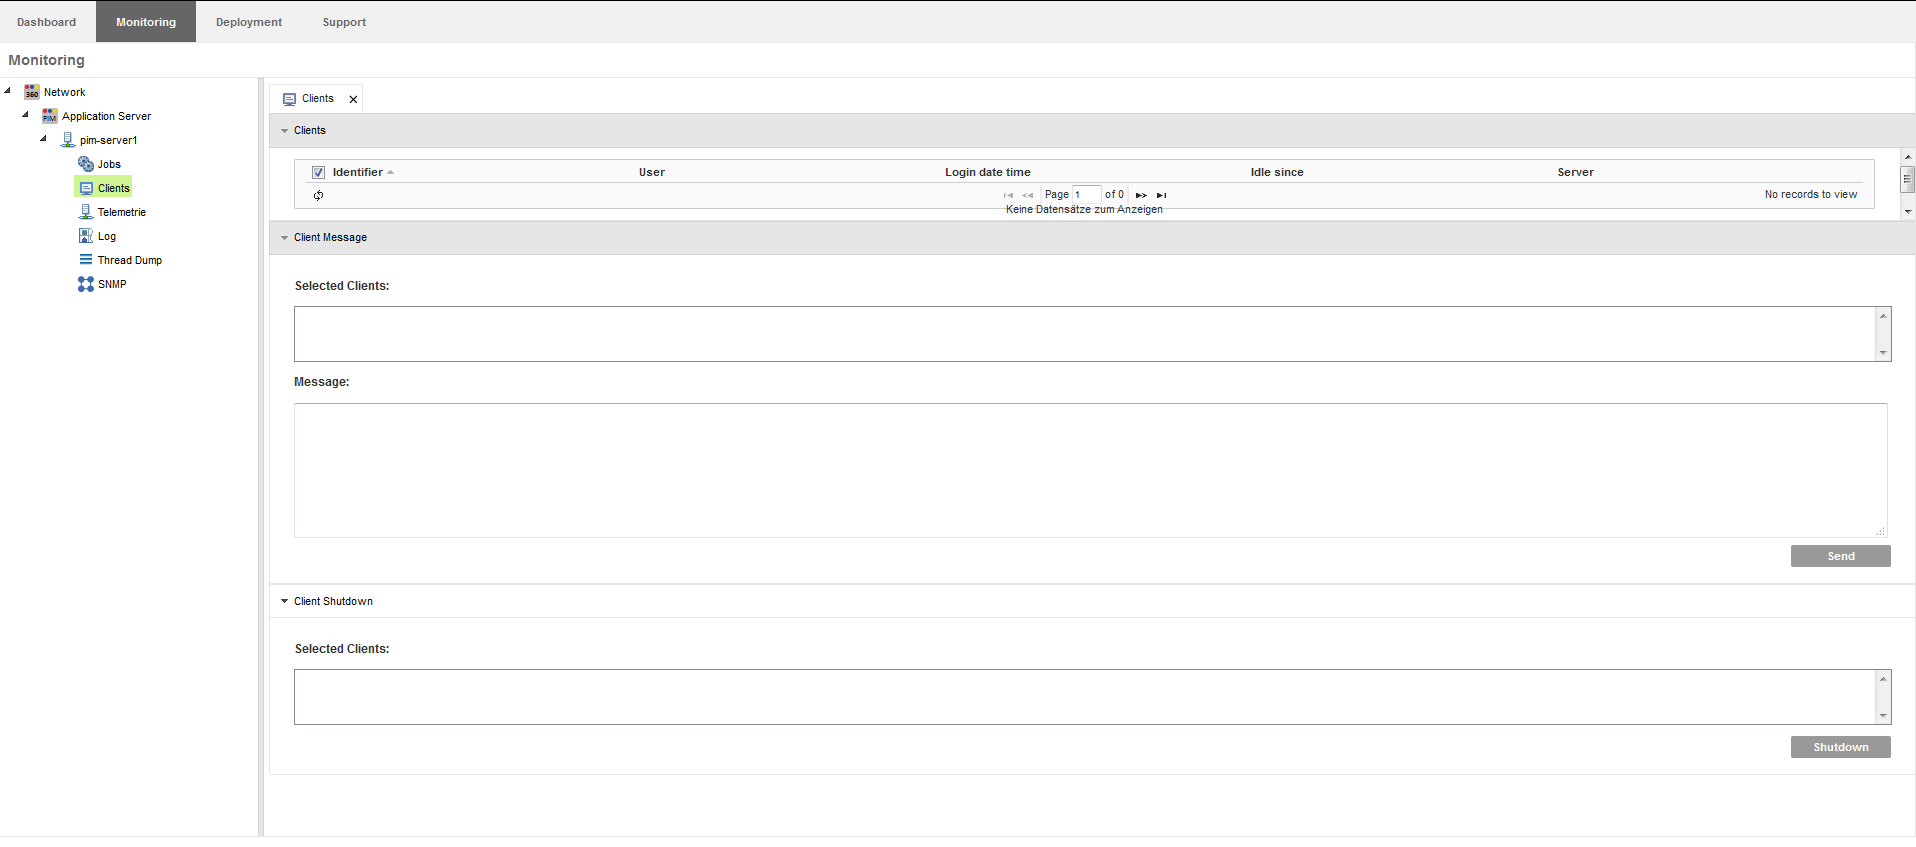
The Clients node shows you once again, which clients are connected to the selected server. From here on out you can write messages to a selected client or shut him down.
Clients, which are connected via web are also shown, but sending messages or the shutdown of web-clients is not supported.
Telemetrie
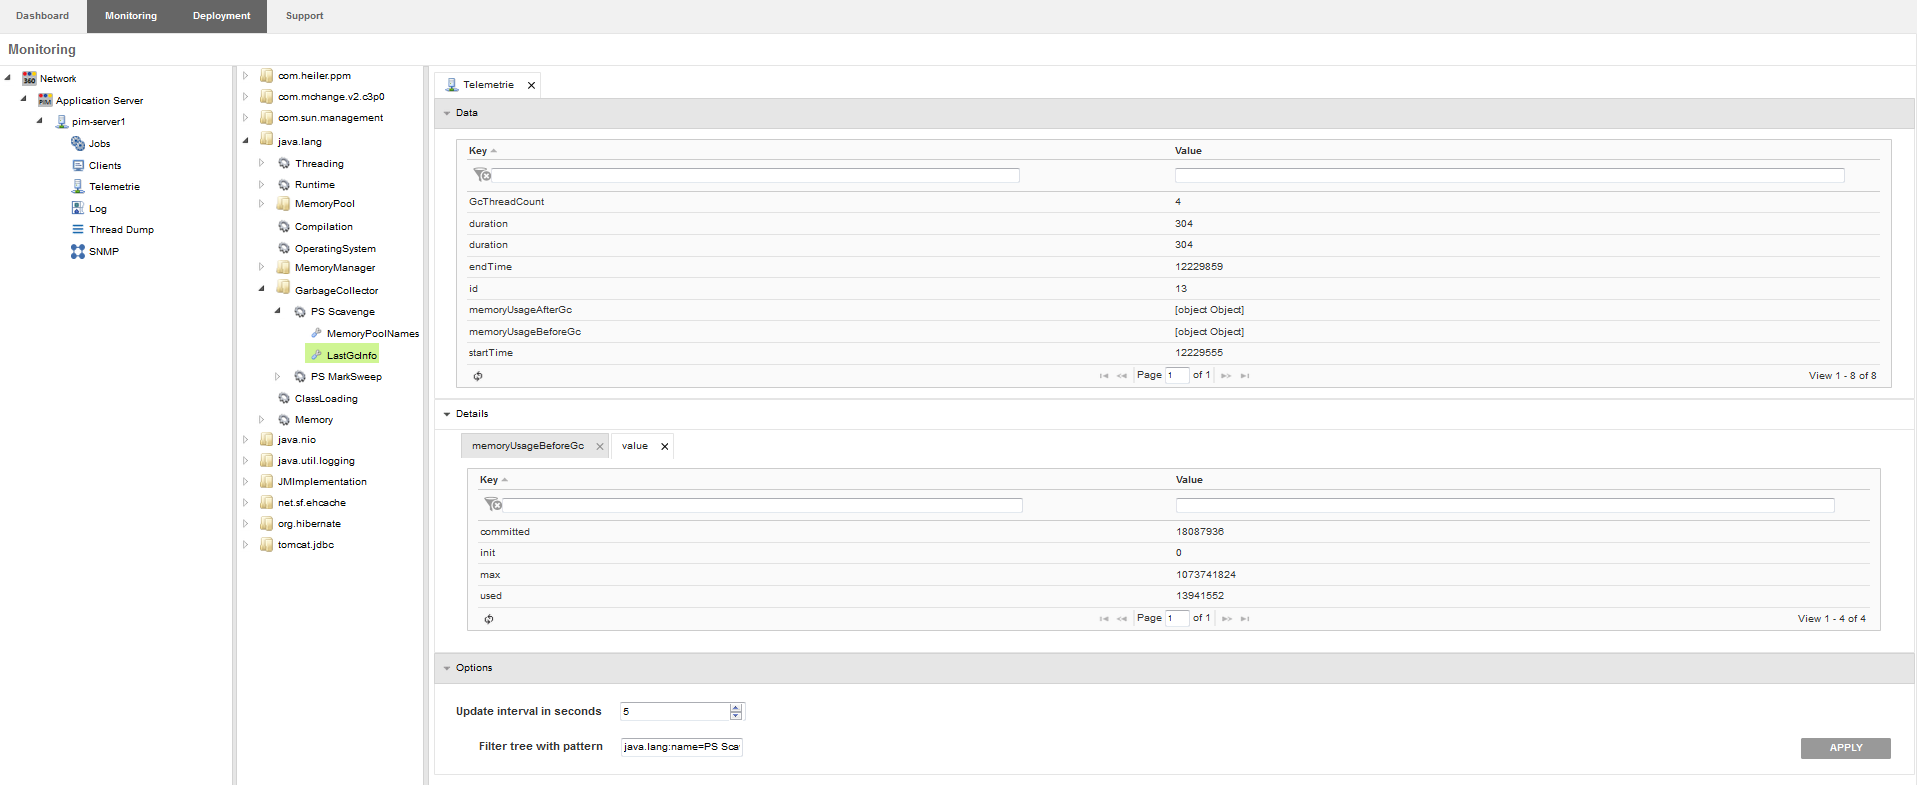
Inside the Telemetry node, you have a wide variety of options. The navigation tree allows you to view all kind of telemetry data. By clicking on a node inside the telemetry navigation tree, you can view dynamicly changing data inside the Data tab. This data is beeing updated in certain time intervalls. To change these time intervalls, simply change the corresponding textfield inside the actions tab and hit enter or select the APPLY button at the bottom right side of the screen.
The pattern field allows you to filter the navigation tree according to your pattern. Simply type in a pattern with the following form: Domain : AttributeName1 = AttributeValue1, . . . , AttributeNameN = AttributeValueN. Filter the tree by hitting enter or selecting the APPLY button.
You open up the Detail View by selecting data that is marked as [Object object] inside the Data tab. Here you can get more detailed information about the selected entity. If you now select data that is marked as [Object object] inside the Detail tab, a new tab opens up and you can view that information inside of it.
Log
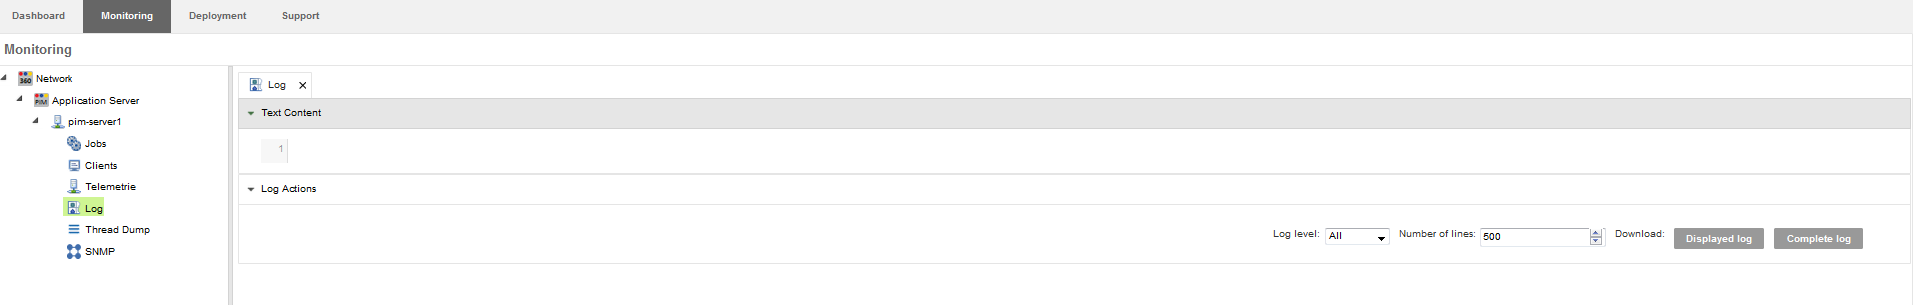
The Log node allows you to view the log of the selected server. While the Text Content Tab periodicly updates and shows the tail of the log of the selected server, you are able to download the complete log file and the displayed log file by simply selecting the corresponding buttons at the right hand side of the Log Actions tab.
Thread Dump
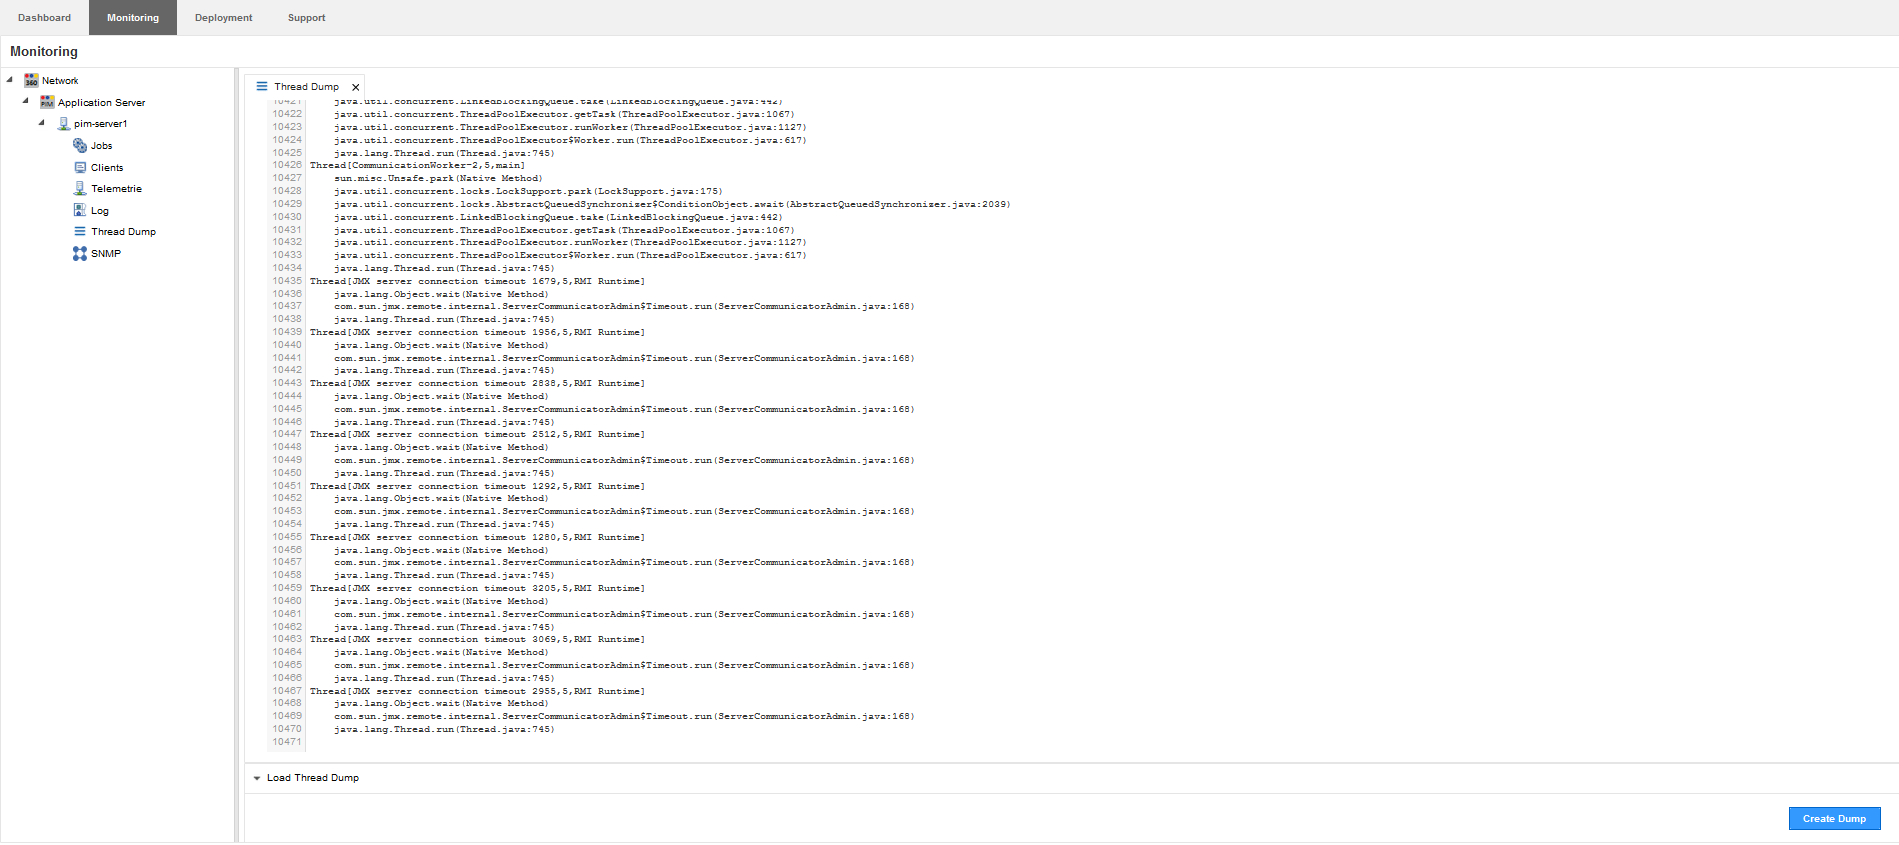
Selecting the Thread Dump node lets you view the current Thread dump of the selected server. Simply select the Create Dump button at the right hand side inside the Load Thread Dump tab. The current Thread dump will than be created inside the Thread Dump tab.
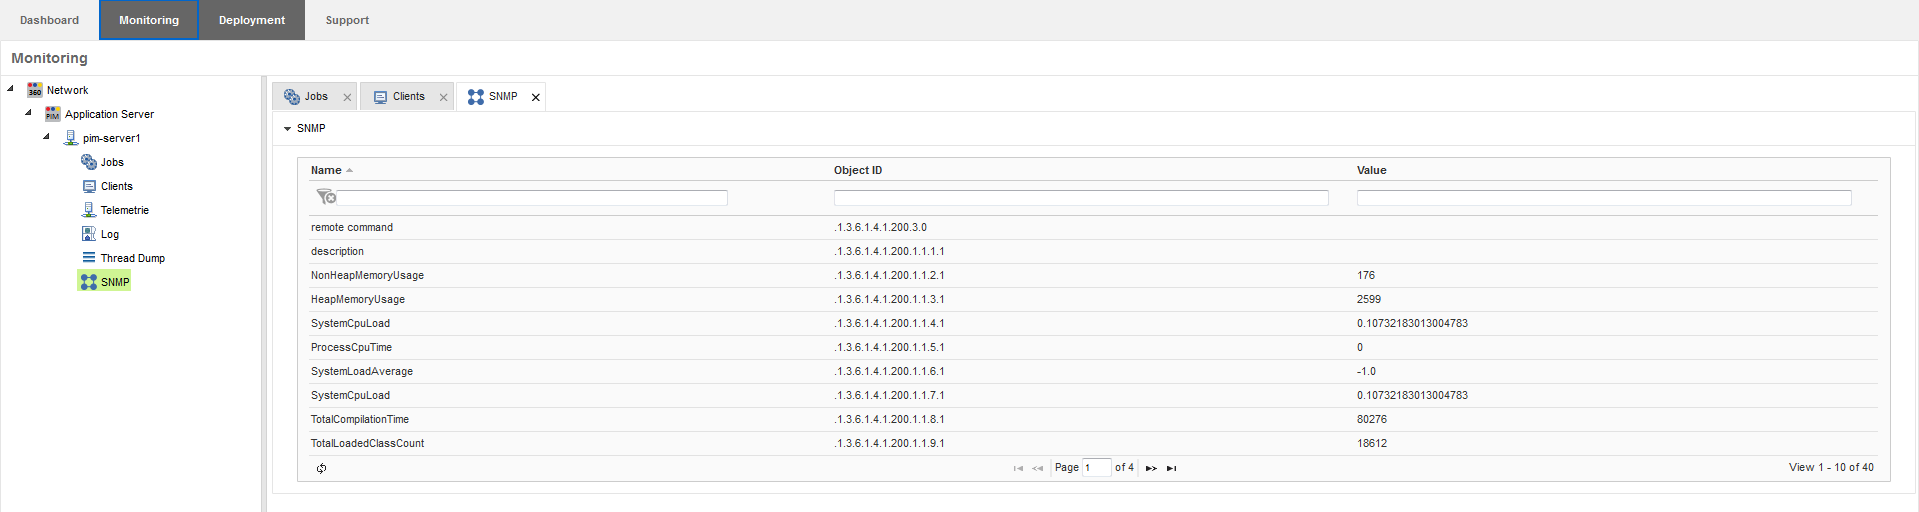
SNMP
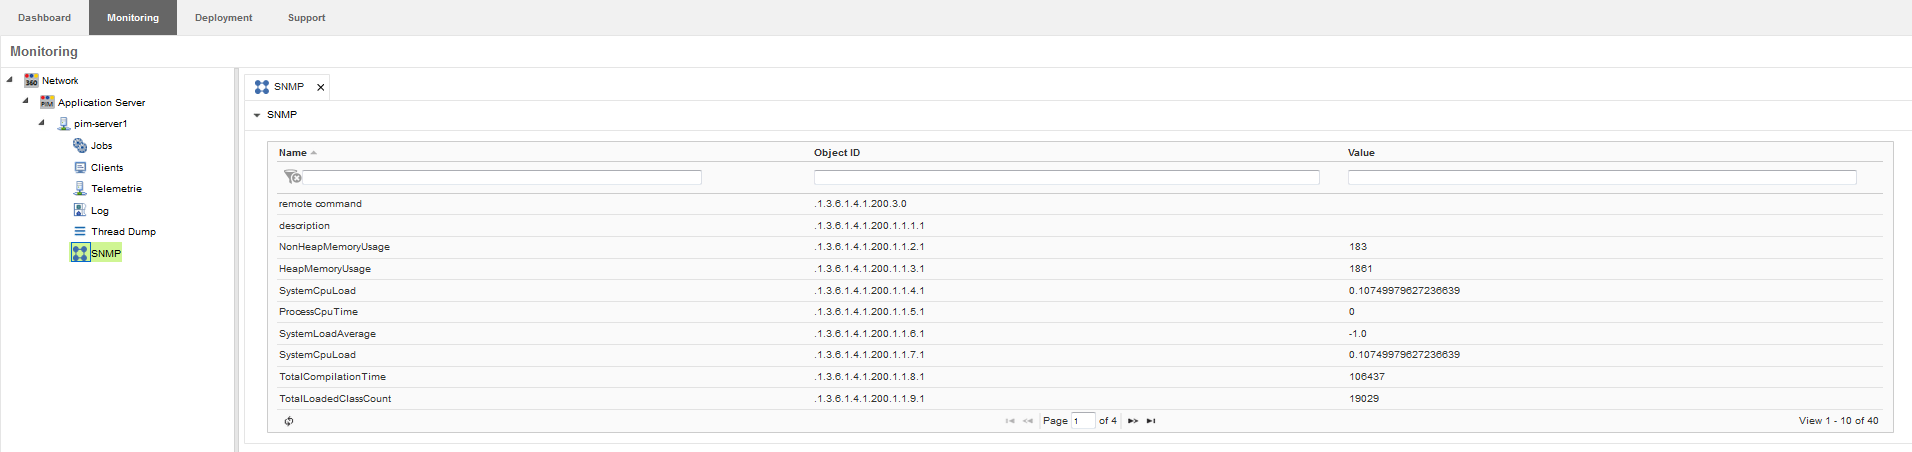
To view data with the Simple Network Management Protocol, you need to follow the configuration instructions at the following location : Instalation and Operation / Operation / Server Operation / SNMP Monitoring.
Selecting the SNMP node, allows you to view all available data of the selected server using SNMP. You can view all available data and its corresponding Object ID(OID) which you can later use to monitore your system, using SNMP.
Deployment
Inside the deployment tab you have the oppotunity to configure and administrate deployed systems inside your network. You can:
administrate and install selected server instalation files
set or change the license file and license key
edit server configuration files remotely
Installation
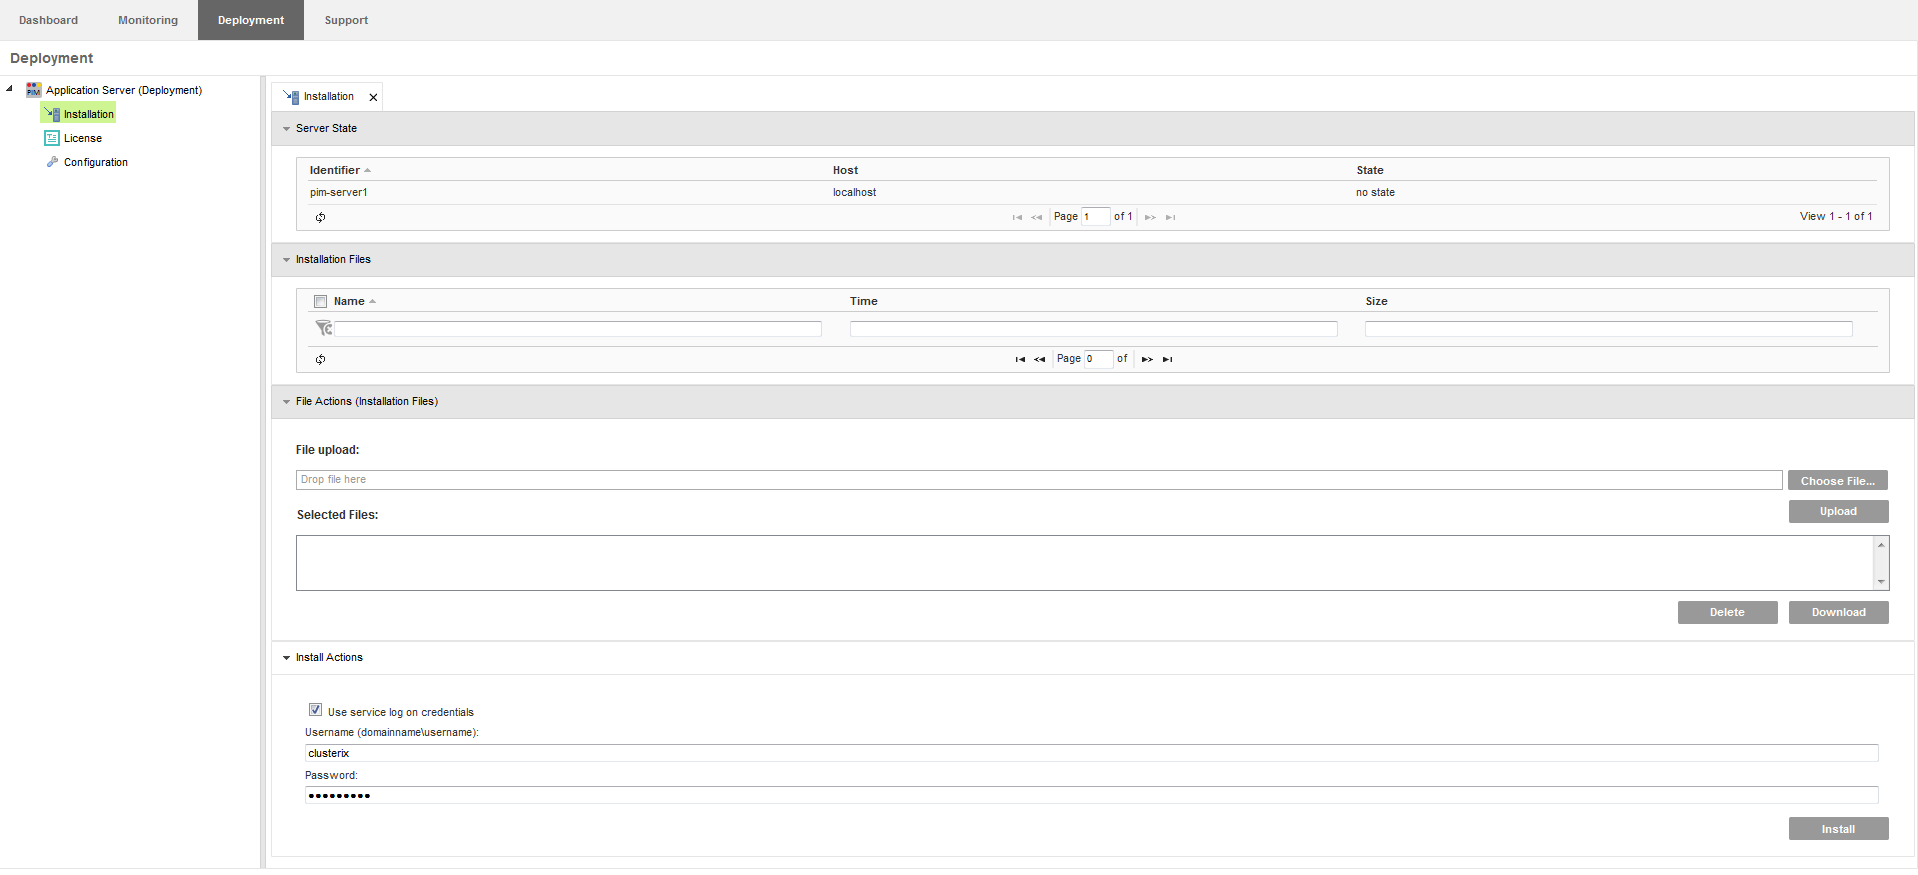
Selecting the Installation node allows you to inspect the installation of the running systems. You can view all running servers at the Server State tab. The Installation Files tab lets you administrate all currently used instalation files. Inside the File Actions tab you have the options to chose installation files yourself and upload them. You can also select already used instalation files and either download or delete them, using the corresponding buttons at the bottom right side. The Install Actions tab allows you to install PIM using the existing installation files.
There are 2 packages which can be installed by the Control Center a full or a delta package. While the Control Center installs a full package completely, it only exchanges individual files from a delta package. The Control Center uses the filename of the package to distinguish whether it is a full or a delta package. The control center sorts the uploaded packages in a reasonable order. Full packages will be installed first, then the delta packages. If there are multiple full or delta packages uploaded, then the packages will be alphanumeric sorted and installed. By sorting the packages, multiple packages can be uploaded and installed at once
Additionally the Control Center always creates a backup of the current installation and saves the backup into the folder clusterix/install/backups. There is no clean up job which removes old files. This have to be done manually.
For a step by step instruction see the Server Installation documentation. Be aware that the files of the server on which you are connected are used to distribute it to the others.
License
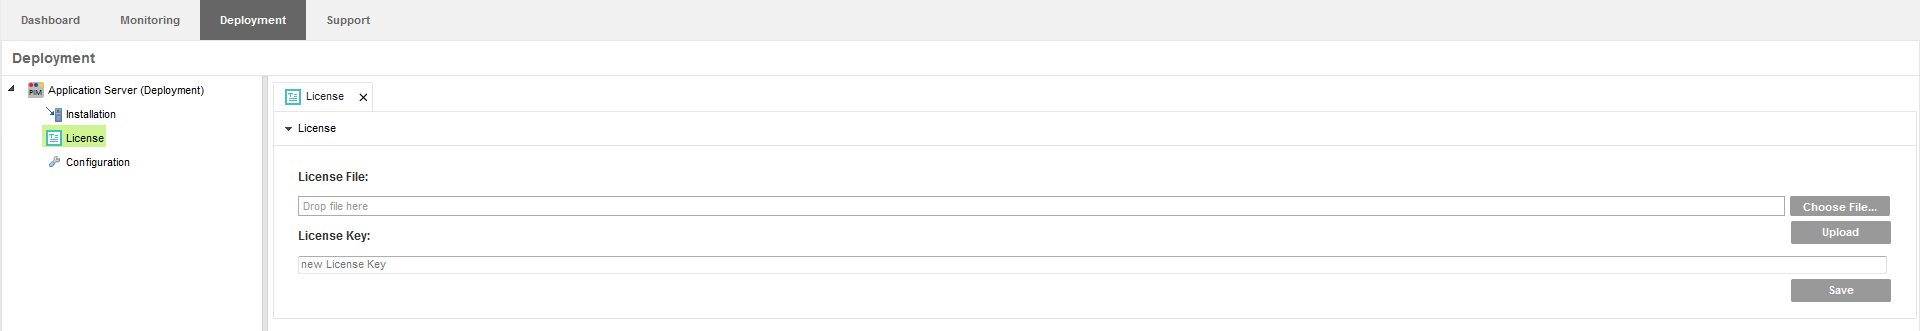
To change the used license file and license key, the License node might be helpfull. inside the License tab you can simply choose and upload a license file using the corresponding buttons at the right hand sie. Pasting a license key inside the license key textfield allows you to use a new license key in your system.
Configuration
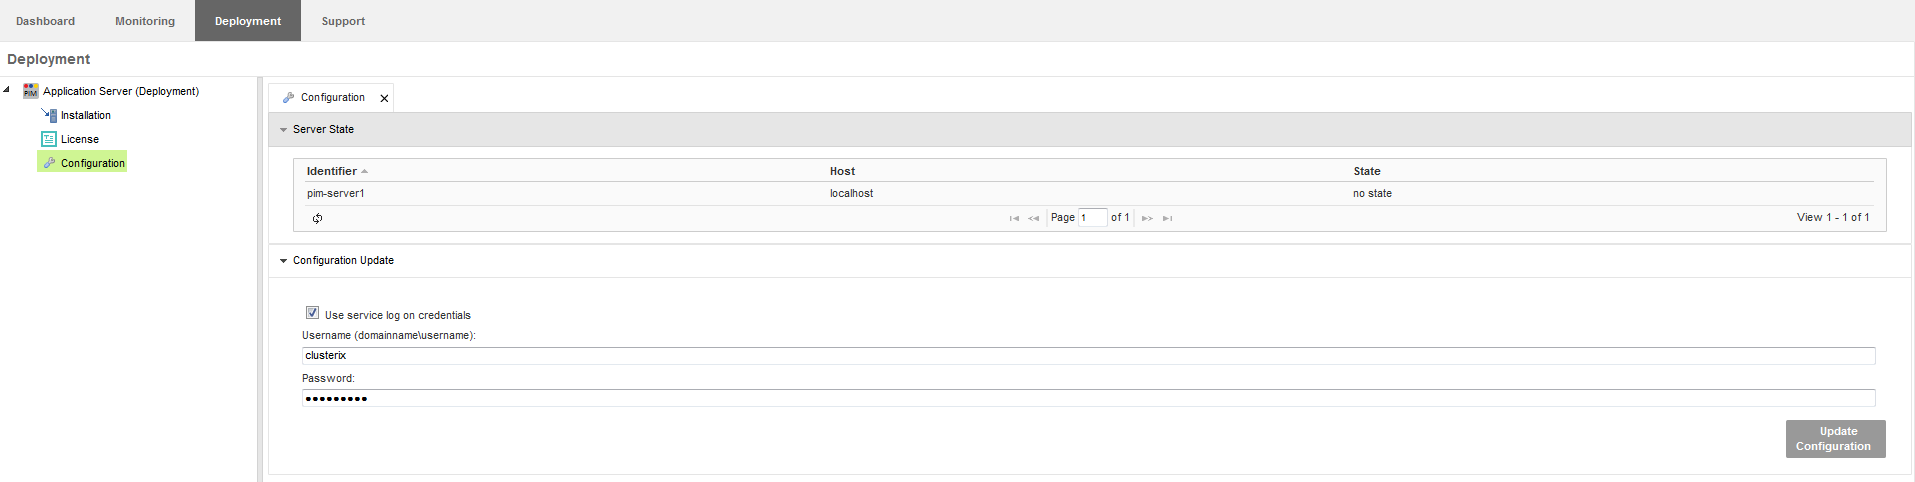
The configuration node allows you to configure used configuration files of your system. After putting in your credentials inside the Configuration Update tab, you can view and configure all kind of system properties inside your network.
Support
The Support tab features tools to support you collecting all kind of system data.
CSM
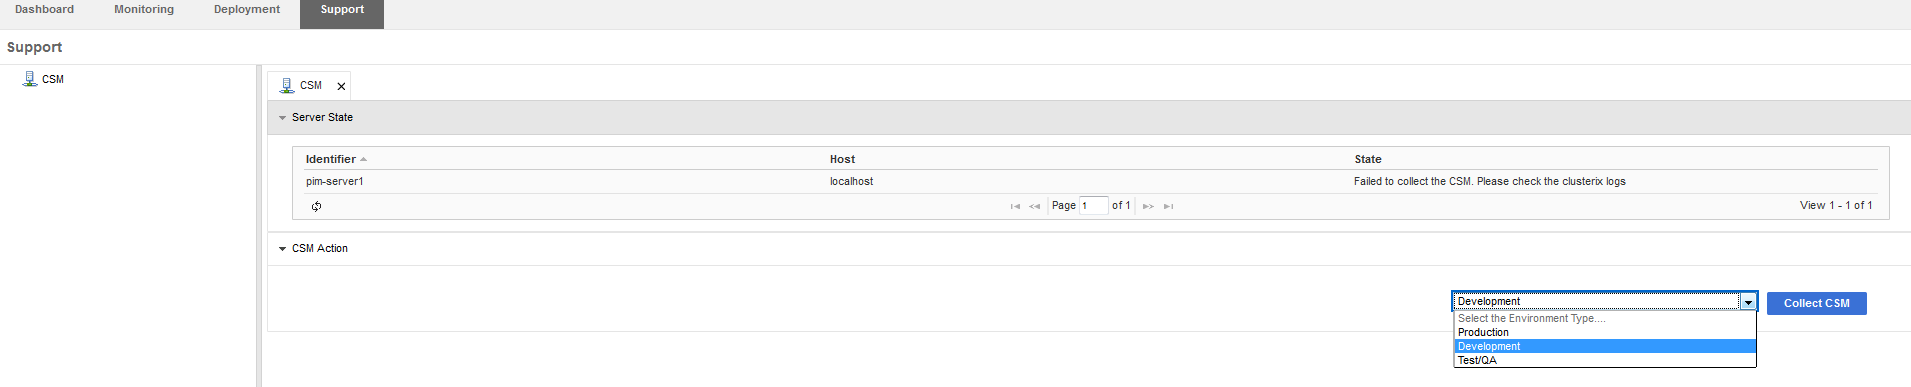
The CSM node allows you to collect data about running servers in your system. Inside the CSM Action tab, select your desired environment type and hit the Collect CSM button. All server will automaticly collect data and present it to you.
Additional Features
Opening multiple tabs
Holding Ctrl and selecting a node inside one of the navigation trees, opens up multiple tabs. You can switch between these tabs by simply clicking on them at the top of the screen.
Telemetrie Actions
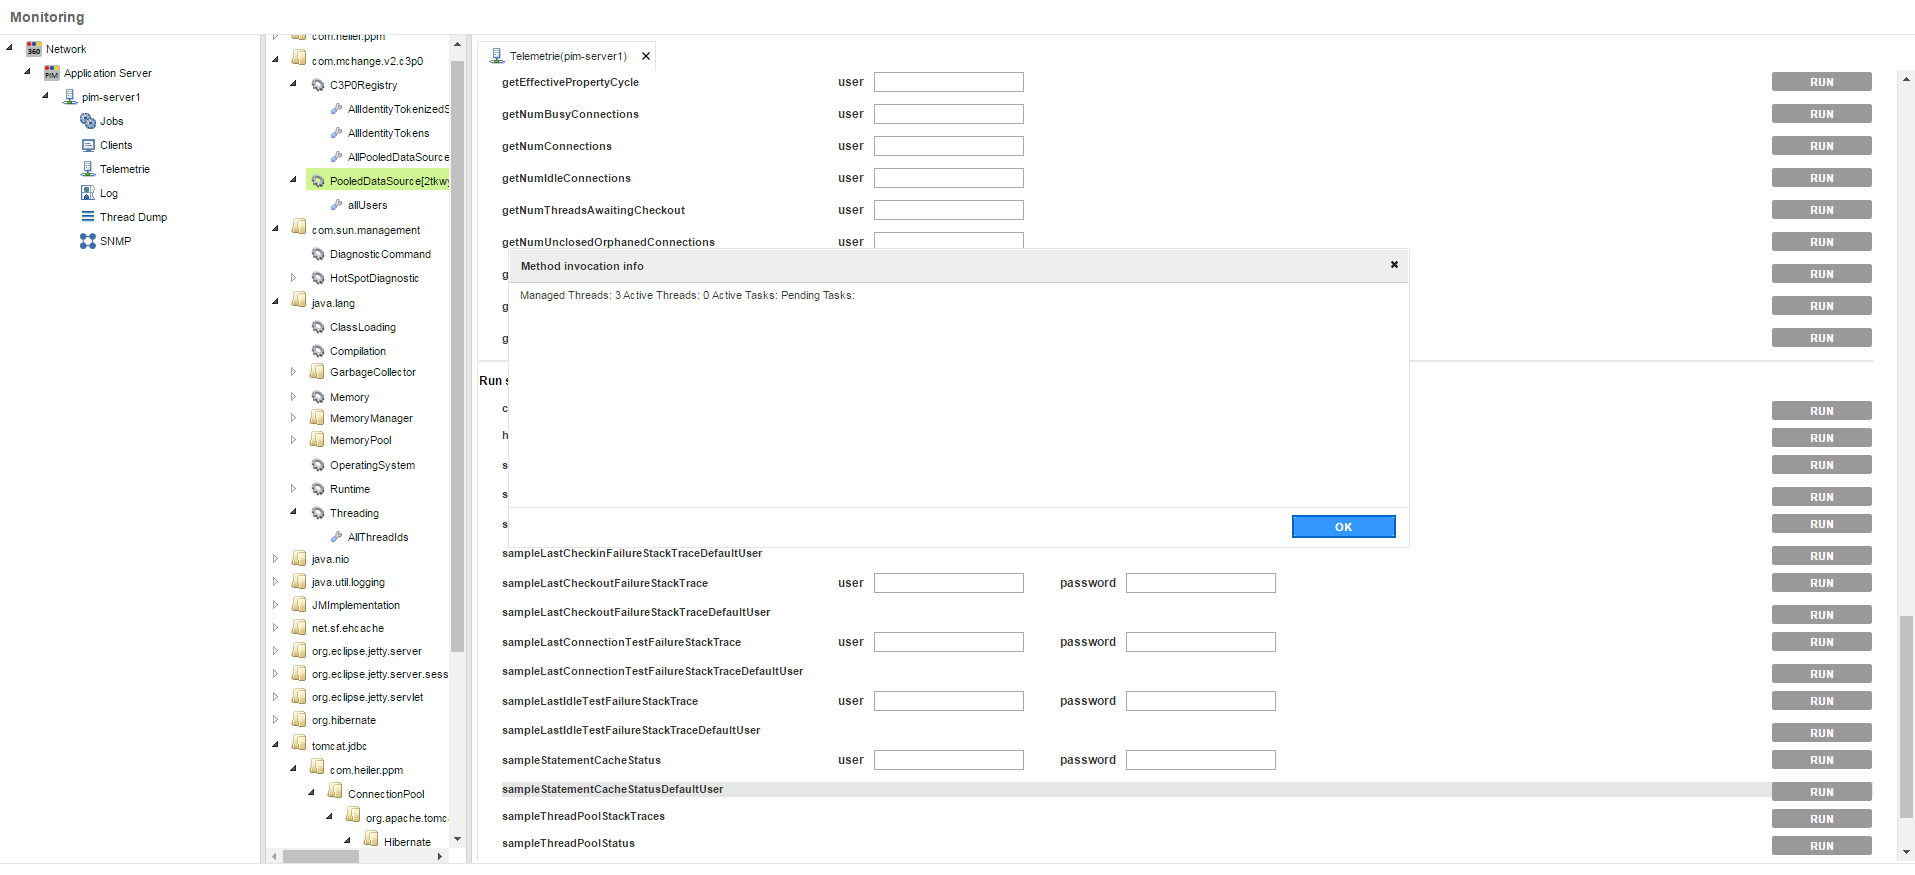
The Telemetrie Actions tab allows you to change data of the selected Node. By carefully filling out the given fields with valid data, you can change system parameters immediately. There are three different kinds of operations available:
Retrieve specific data: Used to get certain information about an object
Change specific data: Used to change specific object values
Run specific data: Used to run specific operations on the given MBean