Installation, Configuration and Operation
Installation
Accelerator package
The application monitoring dashboards are available as out-of-the-box visualizations, in JSON file format, which can be imported directly through the Kibana UI.
The JSON files and reference configurations can be found in the within the PIM_10.1.0.00.00_MicrometerDashboard directory in the PIM_10.1.0.00.00_Accelerators.zip
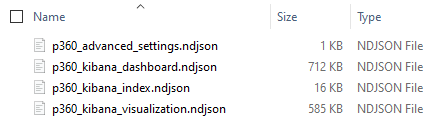
Once downloaded, extract the zip to a folder. Preferably Informatica folder for ease of access. The extracted folder would look as below:

Configuration
ElasticSearch Configuration
The ElasticSearch configuration has to be done in the micrometer.properties file of the corresponding application server. Scroll down to the section for Elastic search and ensure the settings as shown below .
################################################################################ Elastic settings ################################################################################elastic.enabled = true# Ensure that access credentials for elastic search host are added correctly# Please note to not have a trailing slash at the end of the host name!elastic.host = http://myElasticServer.myCompany.com:9200elastic.userName = MyUserelastic.password = MyUserPassword#Do not change the name of the index, otherwise the provided Kibana visualisations #will also need to be adjusted as the index name is configured there!elastic.index = p360_metricselastic.indexDateFormat = yyyy-MMelastic.timestampFieldName = @timestampelastic.autoCreateIndex = trueelastic.step = 1m# Optional parameters#elastic.pipeline =#elastic.indexDateSeparator = #elastic.connectTimeout =#elastic.readTimeout =#elastic.batchSize =Metrics Configuration
Make sure to set the proper system.name property in each server.properties file as well since this property will be used for the appStack tag. The system name will also be used as a prefix for fulltextsearch index name.
Blanks will be replaced with _. Best practice: use 0-9A-Za-z.-
################################################################################### System Settings #################################################################################### Specifies the name of the system, e.g. Test System /Productive System / Demo / Poad etc.# The system name will also be used as a prefix for fulltextsearch index name. # Blanks will be replaced with _. Best practice: use 0-9A-Za-z.- system.name = The Metrics configuration is possible in the log4j2.xml of the corresponding application server. Scroll to the "Metrics" section and replace the existing configuration with the settings below. Micrometer metrics can be enabled completely or for specific sub categories.
For example enabling metrics.databaseTables.job sub category and disabling the parent metrics.databaseTables metrics category, will disable all database table metrics except for database table job metrics.
Use "ERROR" to disable and "INFO" to enable metrics.
<!-- ================ --><!-- Metrics --><!-- ================ --><!-- Micrometer metrics can be enabled completely or for specific sub categories: Use "ERROR" to disable and "INFO" to enable metrics. - "metrics.cache" activates Cache metrics - "metrics.communication" activates Communication Framework metrics - "metrics.databaseTables" activates database tables metrics: - "metrics.databaseTables.masterCatalog" - "metrics.databaseTables.supplierCatalogs" - "metrics.databaseTables.structure" - "metrics.databaseTables.otherEntities" - "metrics.databaseTables.job" - "metrics.databaseTables.meta" - "metrics.dataGraph" activates DataGraph metrics - "metrics.dataQuality" activates DataQuality metrics. - "metrics.detailModel" activates DetailModel metrics - "metrics.hibernate" activates Hibernate metrics - "metrics.hibernate.query" activates Hibernate Query metrics - "metrics.http" activates Http Request metrics. - "metrics.http.response" activates Http Response metrics. - "metrics.jetty" activates Jetty metrics - "metrics.log4j2" activates Log4j2 metrics - "metrics.login" activates Login metrics. - "metrics.login.user" activates Login user metrics. - "metrics.mediator" activates Mediator metrics - "metrics.mediator.submediator" activates Sub-Mediator metrics - "metrics.persistenceManager" activates PersistenceManager metrics - "metrics.restClient" activates REST client metrics - "metrics.auditTrail" activates Audit trail metrics - "metrics.import" activates Import metrics - "metrics.import.persistence" activates Import persistence metrics - "metrics.import.storage" activates Import storage metrics - "metrics.triggerService" activates Trigger Service metrics --><Logger name="metrics" level="INFO" additivity="false" /><!-- Following metrics are disabled by default for performance reasons, enable only for debugging --><!--Cache, Communication, http, hibernate --><Logger name="metrics.cache" level="ERROR" additivity="false" /> <Logger name="metrics.communication" level="ERROR" additivity="false" /> <Logger name="metrics.http" level="ERROR" additivity="false" /> <Logger name="metrics.hibernate" level="ERROR" additivity="false" /> <!-- Database Tables metrics are disabled by default, Except for Job, for performance reasons, enable only for debugging--><Logger name="metrics.databaseTables" level="INFO" additivity="false" /> <Logger name="metrics.databaseTables.job" level="INFO" additivity="false" /> <Logger name="metrics.databaseTables.masterCatalog" level="ERROR" additivity="false" /> <Logger name="metrics.databaseTables.supplierCatalogs" level="ERROR" additivity="false" /> <Logger name="metrics.databaseTables.structure" level="ERROR" additivity="false" /> <Logger name="metrics.databaseTables.otherEntities" level="ERROR" additivity="false" /> <Logger name="metrics.databaseTables.meta" level="ERROR" additivity="false" /> <!-- Sub mediator metrics are disabled by default for performance reasons, enable only for debugging--><Logger name="metrics.mediator" level="INFO" additivity="false" /> <Logger name="metrics.mediator.submediator" level="ERROR" additivity="false" /> Import of Kibana Saved Objects
Please note that from version Elastic Kibana 7.7 onwards, you might have to create a dedicated space for p360 metrics first before importing the saved objects. The imported settings, index pattern, visualizations and dashboards should reside in this space.
Once the above mentioned Product 360 server configurations are complete, the Kibana JSON objects for settings, index pattern, visualisations and dashboards can be imported.
For this open the Kibana > Management > Saved Objects page and Import the JSON objects "P360 Micrometer Kibana Dashboard Config" directory, in the following order:
p360_advanced_settings.ndjson: Optimal settings for performant aggregation queries
p360_kibana_index.ndjson: The Kibana index pattern for "p360-metrics-idx" mapping the metrics fileds to the Product 360 metrics index
p360_kibana_visualization.ndjson: The individual Kibana metric visualisations
p360_kibana_dashboard.ndjson: The 3 Product 360 application and system monitoring dashboards
Once the above objects are successfully imported, ensure the following settings are enabled in the Kibana > Management > Advanced Settings
Default index : p360-metrics-idx
Index pattern placeholder : p360_metrics-*
Store URLs in session storage : On
Maximum buckets : 20000