How to create a thread dump
This page describes how to obtain a thread dump for the product manager's client and server. A thread dump returns the stack traces of all threads of the java virtual machine it's executed on, at the moment of execution.
Control Center
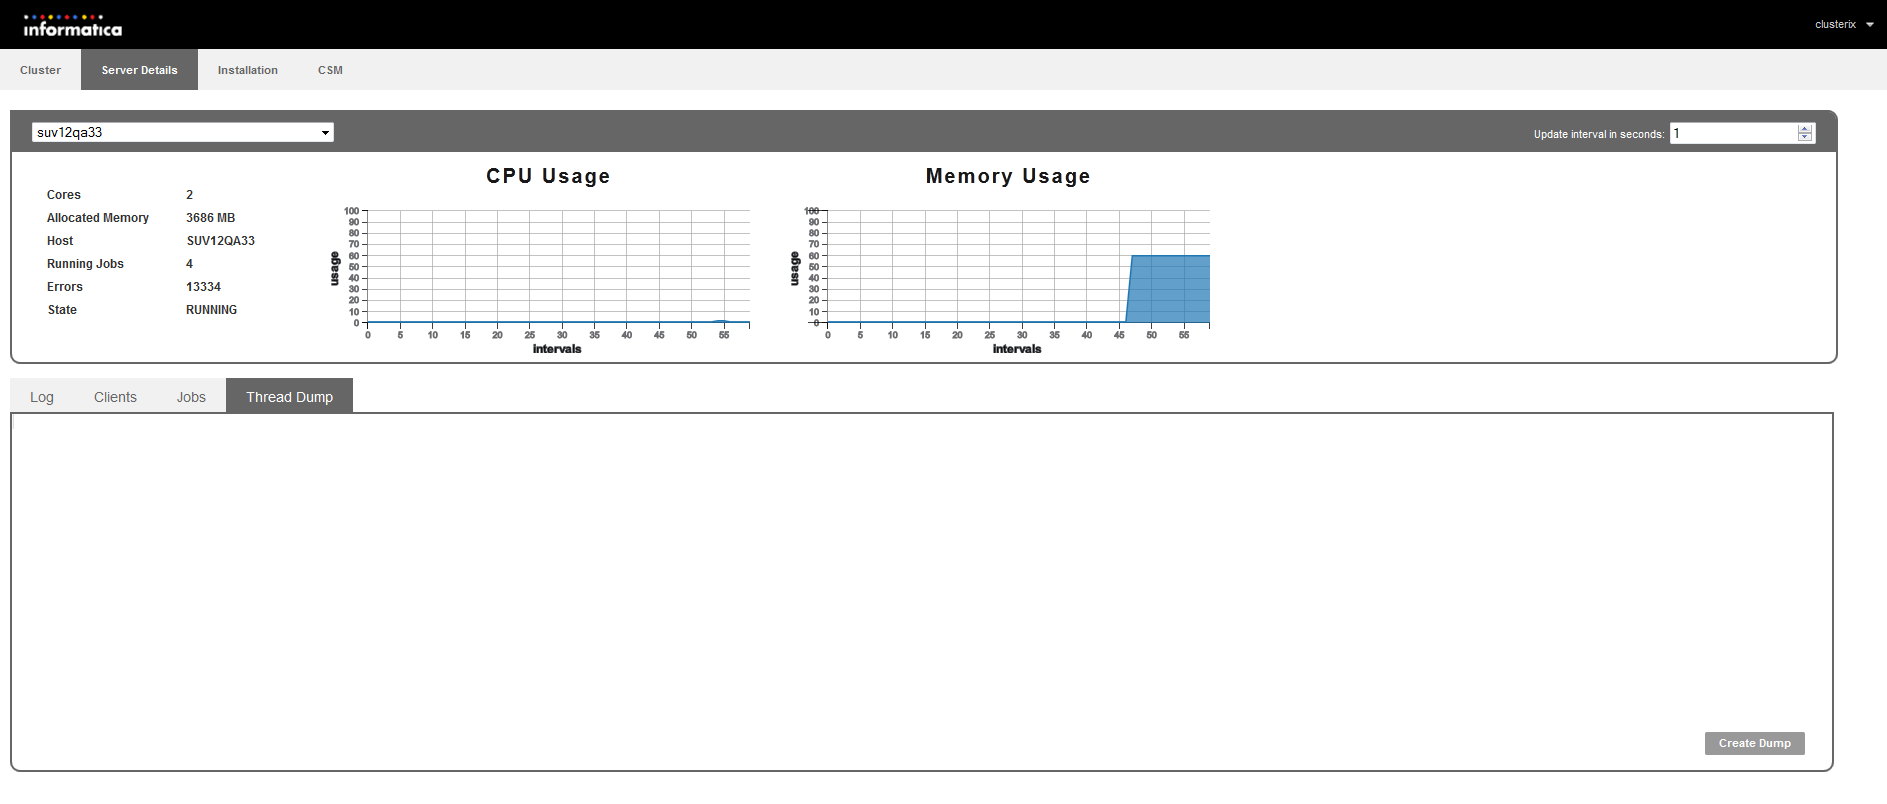
The easiest way to create a thread dump of a running server is by using the Control Center. In the Server details view you can find the Thread Dump tab. By clicking on Create Dump, the dump will be created for the selected server and displayed in the view where it can be analyzed.
Console Window
When the client or server is being executed in debug mode (using the start_debug.cmd files) you can easily perform a thread dump to the console window. Just press CTRL + BREAK. This will print the stack trace to the console window.
Starting with PIM - Server version 5.x this also performs a memory dump - which might take a while.
Of course, this is no feasible way for a productive system, which should not be run in debug mode at all!
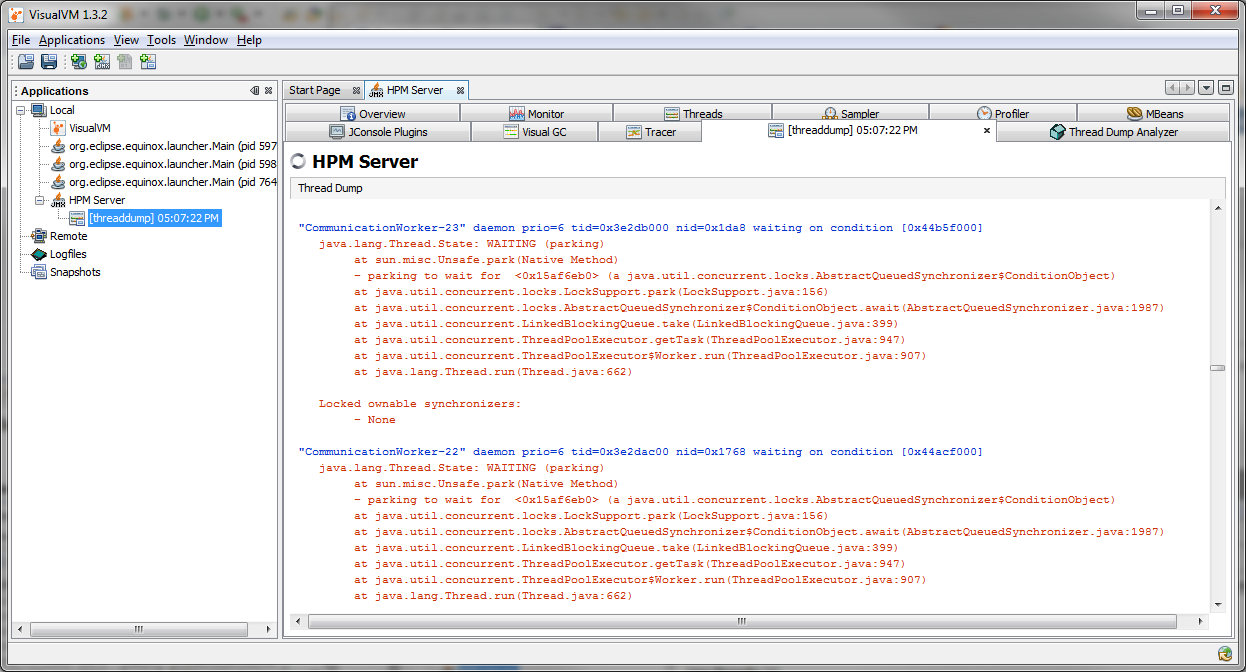
VisualVM (JMX Interface)
With VisualVM you can connect to a running java virtual machine and perform a thread dump at any given time. Please see the Tuning Advisory for details on how to enable the JMX (Java Management eXtension) for the server.
Open Visual VM
Switch to "Threads" view
Click on "Thread Dump"
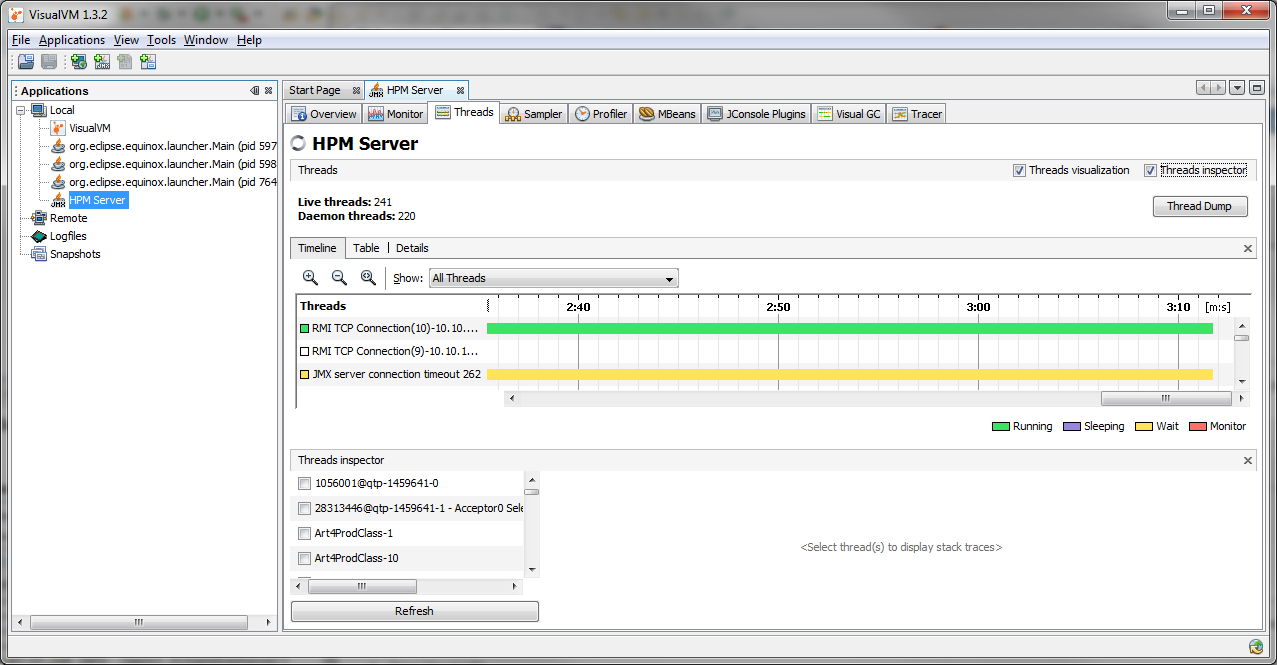
Thread dump opens in new view
If you have the choice, use Visual VM - it's much easier to work with ![]()
If the tool hangs during Thread dump loading, you can also find the written DUMPs in the local user directory at C:\Users\<userId>\AppData\Roaming\VisualVM\8u40\repository\jmxapplications
Analyzing Thread Dumps
Analyzing Thread Dumps requires some internal knowledge of PIM Server architecture. Here are some useful hints:
The purpose of thread groups can be usually determined by the thread's name.
CommunicationWorker are used by the internal communication framework to process requests from clients
http-* are managed by Jetty web server and used for both PIM Web as well as REST calls
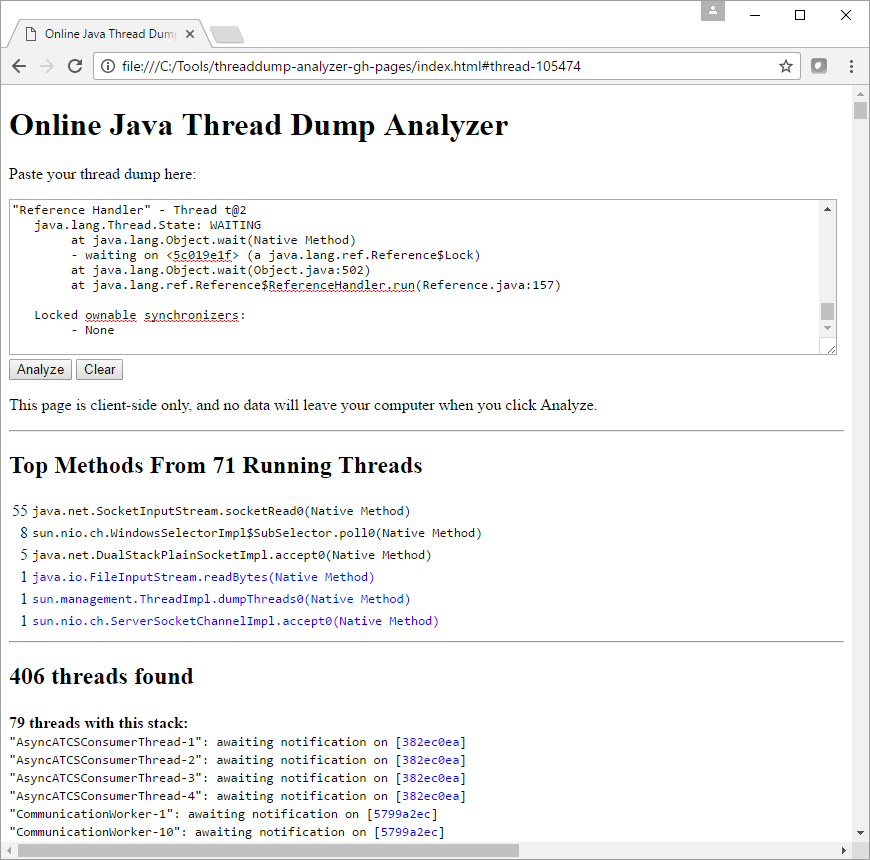
A useful tool for analyzing ThreadDumps is ThreadDumpAnalyzer https://github.com/spotify/threaddump-analyzer
It's JavaScript based and can be executed locally on a html page.
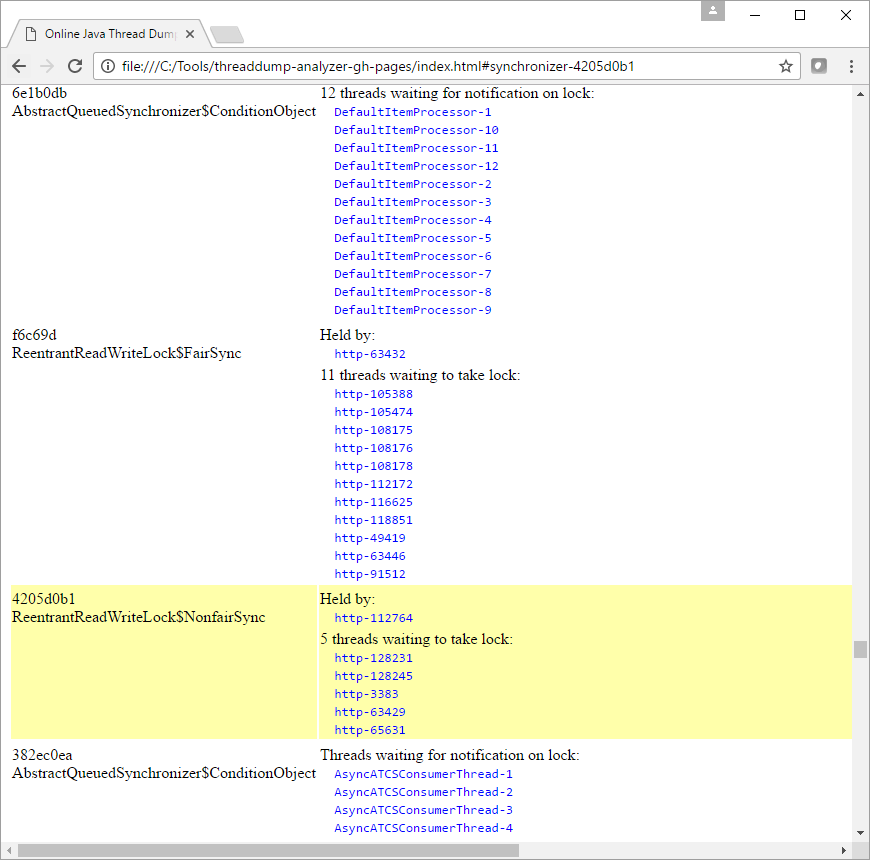
Threads with identical stacks are grouped
Locks between threads are visualized