System Metrics Dashboard
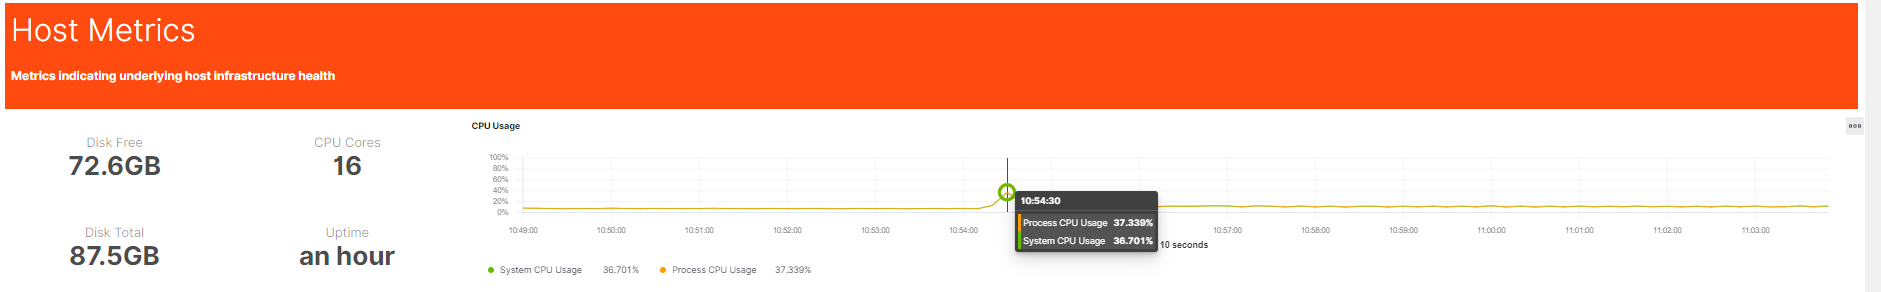
Host Metrics
Metrics indicating underlying host infrastructure health.
|
Metric Name |
Metric Key |
Description |
|
Disk Space Free |
disk_free |
The available disk space of the drive where Product 360 is installed |
|
Disk Space Total |
disk_total |
The total disk space of the drive where Product 360 is installed |
|
CPU Count |
system_cpu_count |
The available system processors |
|
CPU Usage |
system_cpu_usage |
The current system CPU utilization |
|
Process Uptime |
process_uptime |
The amount of time the Product 360 service is running |
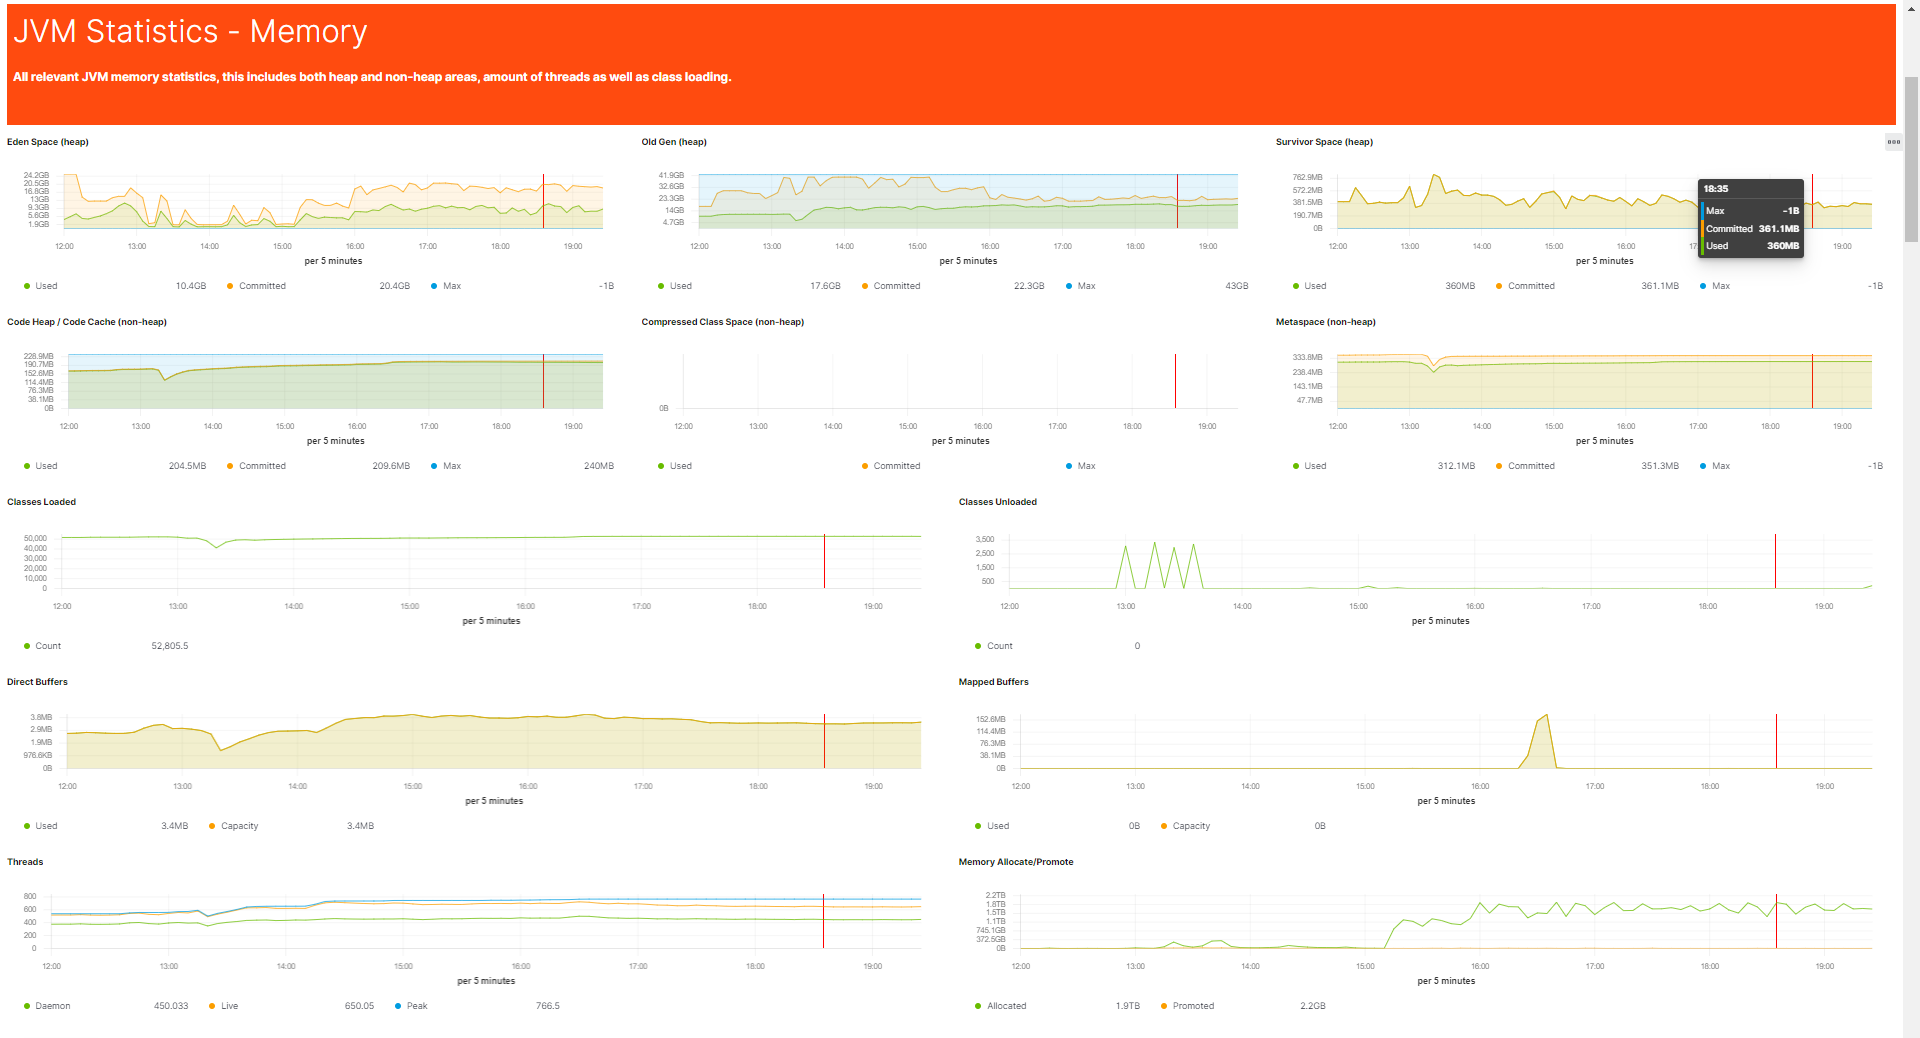
JVM Statistics - Memory
All relevant JVM memory statistics, this includes both heap and non-heap areas, amount of threads as well as class loading.
|
Metric Name |
Metric Key |
Description |
|
Classes Loaded |
jvm_classes_loaded |
The amount of classes loaded by the JVM. |
|
Classes Unloaded |
jvm_classes_unloaded |
The amount of classes unloaded by the JVM. |
|
Buffer Memory |
jvm_buffer_memory_used |
The amount of buffer memory used by the JVM. |
|
Memory Usage |
jvm_memory_used |
The amount of memory used by the JVM. |
|
Threads |
jvm_threads_daemon |
The amount of threads used by the JVM. |
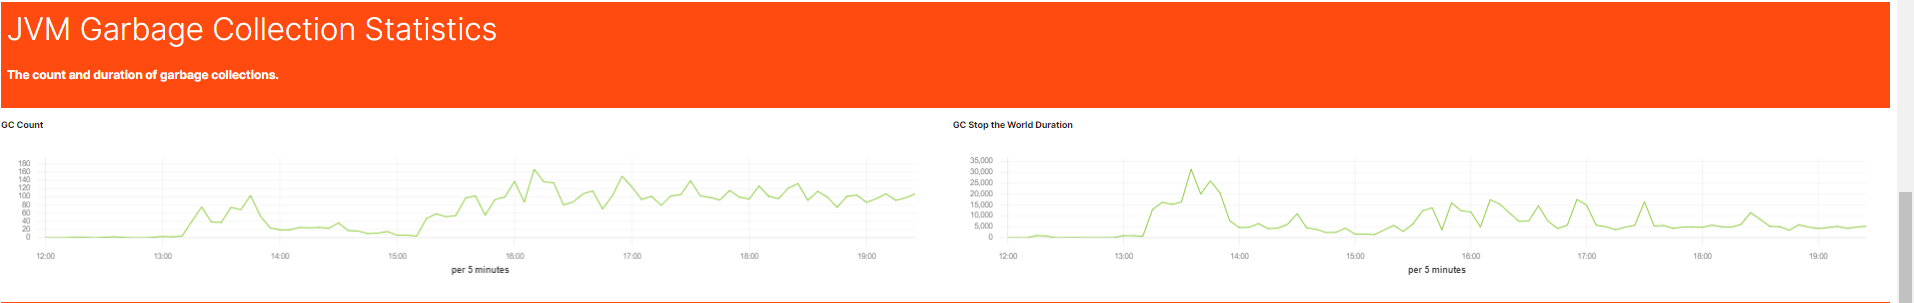
JVM Garbage Collection Statistics
JVM garbage collection metrics include the count and duration of garbage collections.
While a high count can be fine, a high duration usually suggests that the application is running low on heap memory.
|
Metric Name |
Metric Key |
Description |
|
GC Count |
jvm_gc_pause |
The amount of garbage collections executed by the JVM |
|
GC Stop the World Duration |
jvm_gc_pause |
The duration of the garbage collections executed by the JVM |
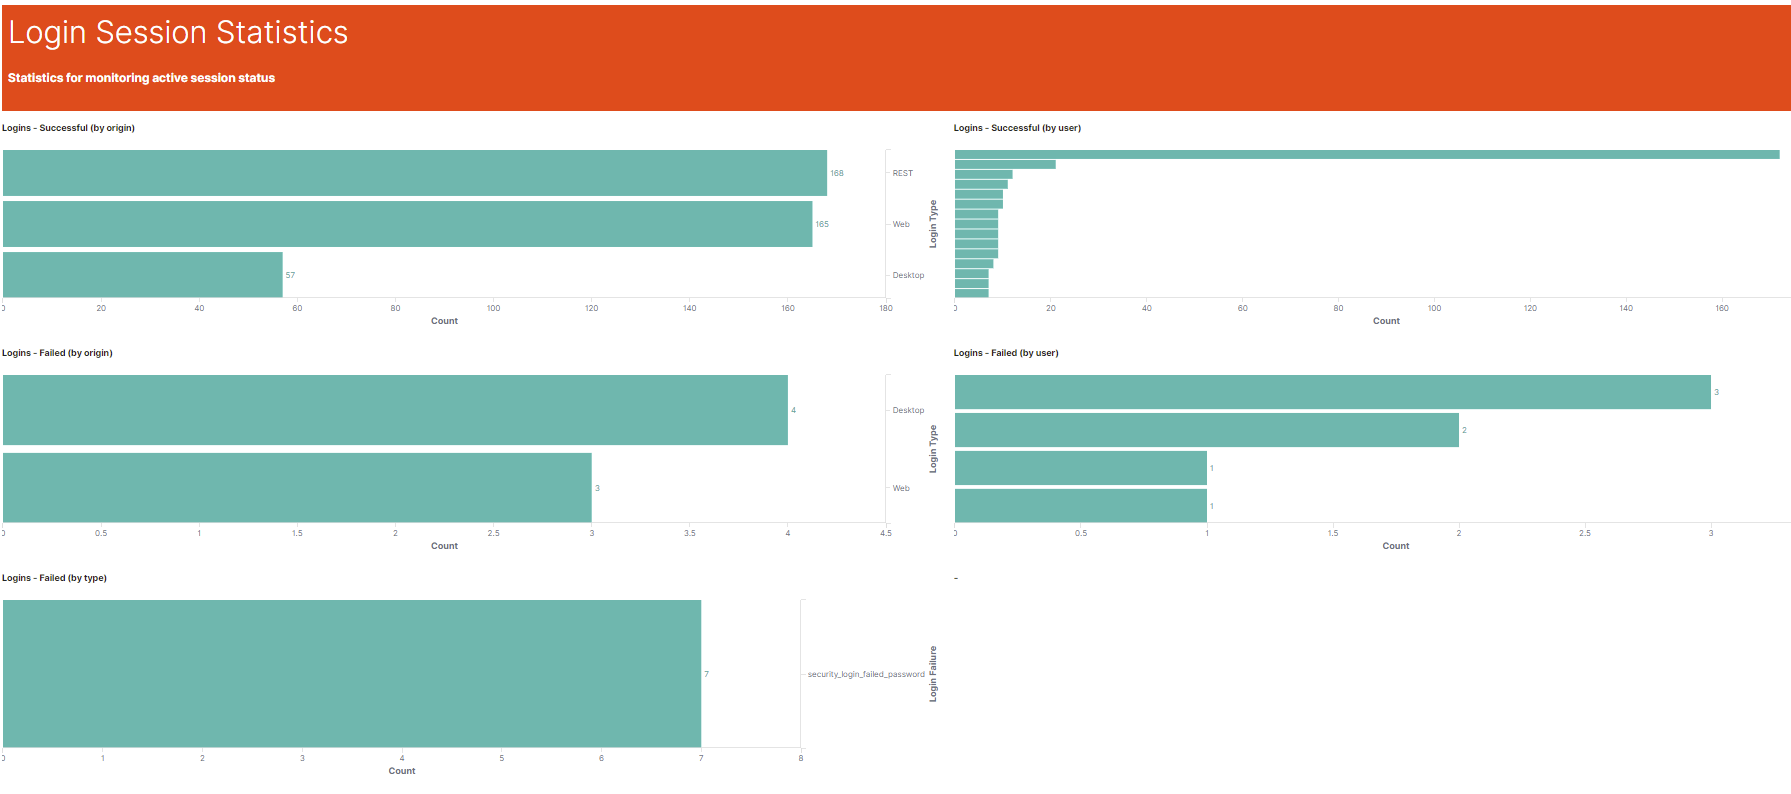
Login Session Statistics
Statistics for monitoring active session status.
|
Metric Name |
Metric Key |
Description |
|
Login Successful |
security_login_successful |
The amount of successful logins |
|
Login Failed |
security_login_failed_admin |
The amount of failed logins for Administrator account |
|
security_login_failed_inactive |
The amount of failed logins for inactive accounts |
|
|
security_login_failed_password |
The amount of failed logins due to wrong password |
|
|
security_login_failed_permission |
The amount of failed logins due to insufficient permissions |
|
|
security_login_failed_other |
The amount of failed logins for any other reason |
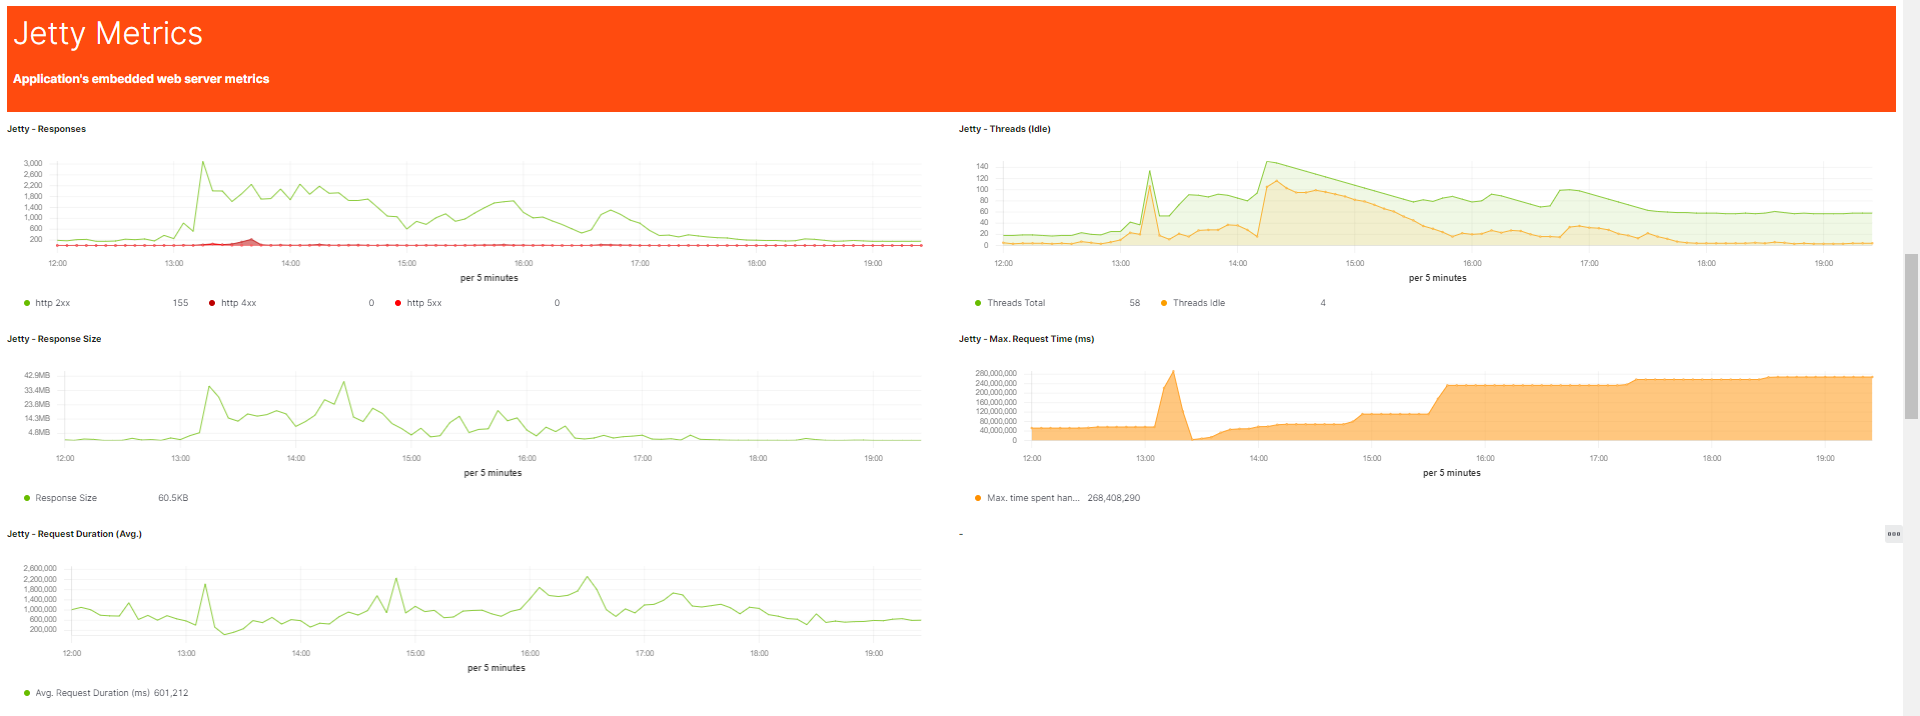
Jetty (Web Service Framework) Statistics
Application's embedded web server metrics.
|
Metric Name |
Metric Key |
Description |
|
Request Duration |
jetty_requests |
The average duration of a web service request |
|
Request Max. Time |
jetty_dispatched_time_max |
The maximum duration of a web service request |
|
Response Size |
jetty_responses_size |
The size of response payload of the web service request |
|
Responses |
jetty_responses |
The amount of responses to web service requests |
|
Threads |
jetty_threads_current |
The current amount of JVM threads |
Connection Pool Statistics
Metrics pertaining connection events such as creation, usage, return to connection pool etc.
Every data source has its own connection pool. A connection must be created, used, and returned to the connection pool and there are metrics for all events.
Important connection pool metrics are the amount of open connections, and how many of these connections are active or idling. It is important to watch for anything out of the ordinary, i.e. connection timeouts, many active connections and especially if any overflow of the connection pool takes place.
Global filter : Database
The database filter allows filtering (drill-down) of metrics regarding any kind of database activity.
For example it is possible to show all active connections for a specific database.
Please note that not all metrics are related to the database and won't show any data while the database has been selected.
pool
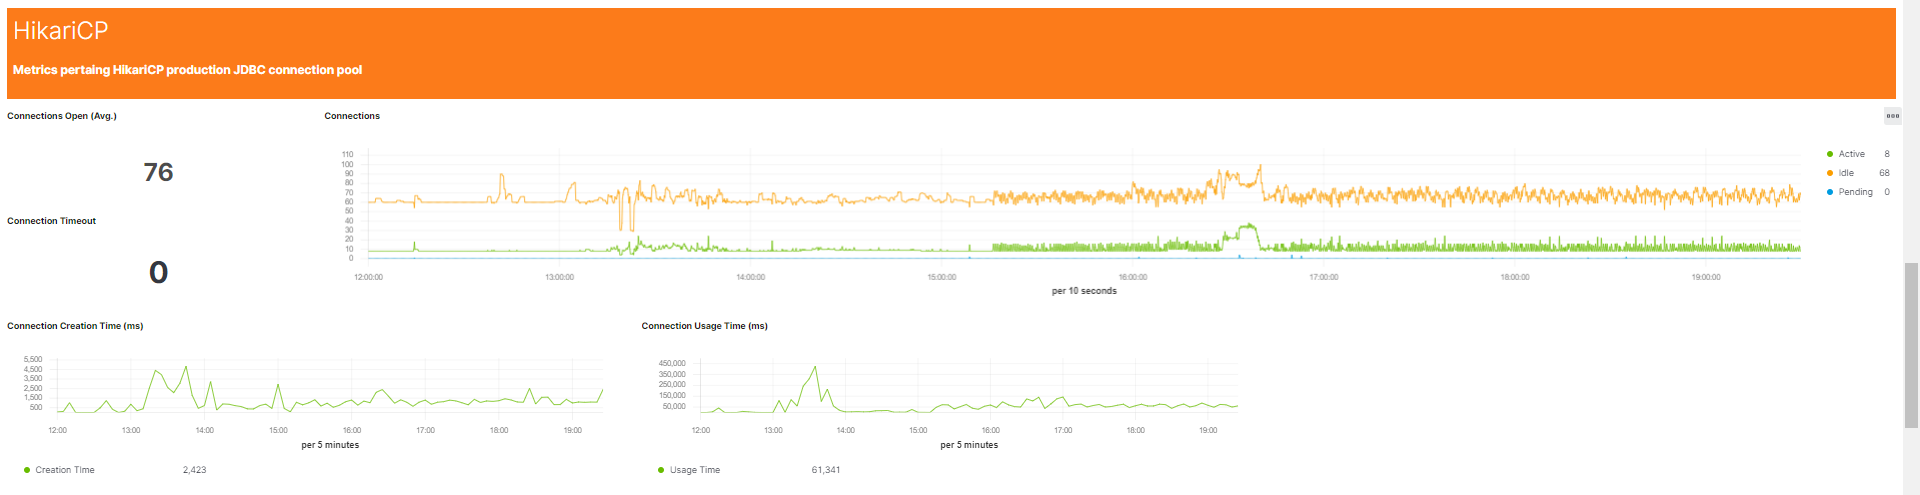
Database HikariCP Statistics
Metrics pertaining HikariCP production JDBC connection pool.
|
Metric Name |
Metric Key |
Description |
|
Connection Acquire Time |
hikaricp_connections_acquire |
The amount of time it took to acquire a connection from the connection pool |
|
Connection Creation Time |
hikaricp_connections_creation |
The amount of time it took to create a connection for the connection pool |
|
Connection Timeout Count |
hikaricp_connections_timeout |
The amount of timeouts while requesting a connection from the connection pool |
|
Connection Usage Time |
hikaricp_connections_usage |
The amount of time the connection from the connection pool was in use |
|
Connections |
hikaricp_connections_active |
The amount of active connections in the connection pool |
|
Connections Size |
hikaricp_connections |
The amount of connections in the connection pool |
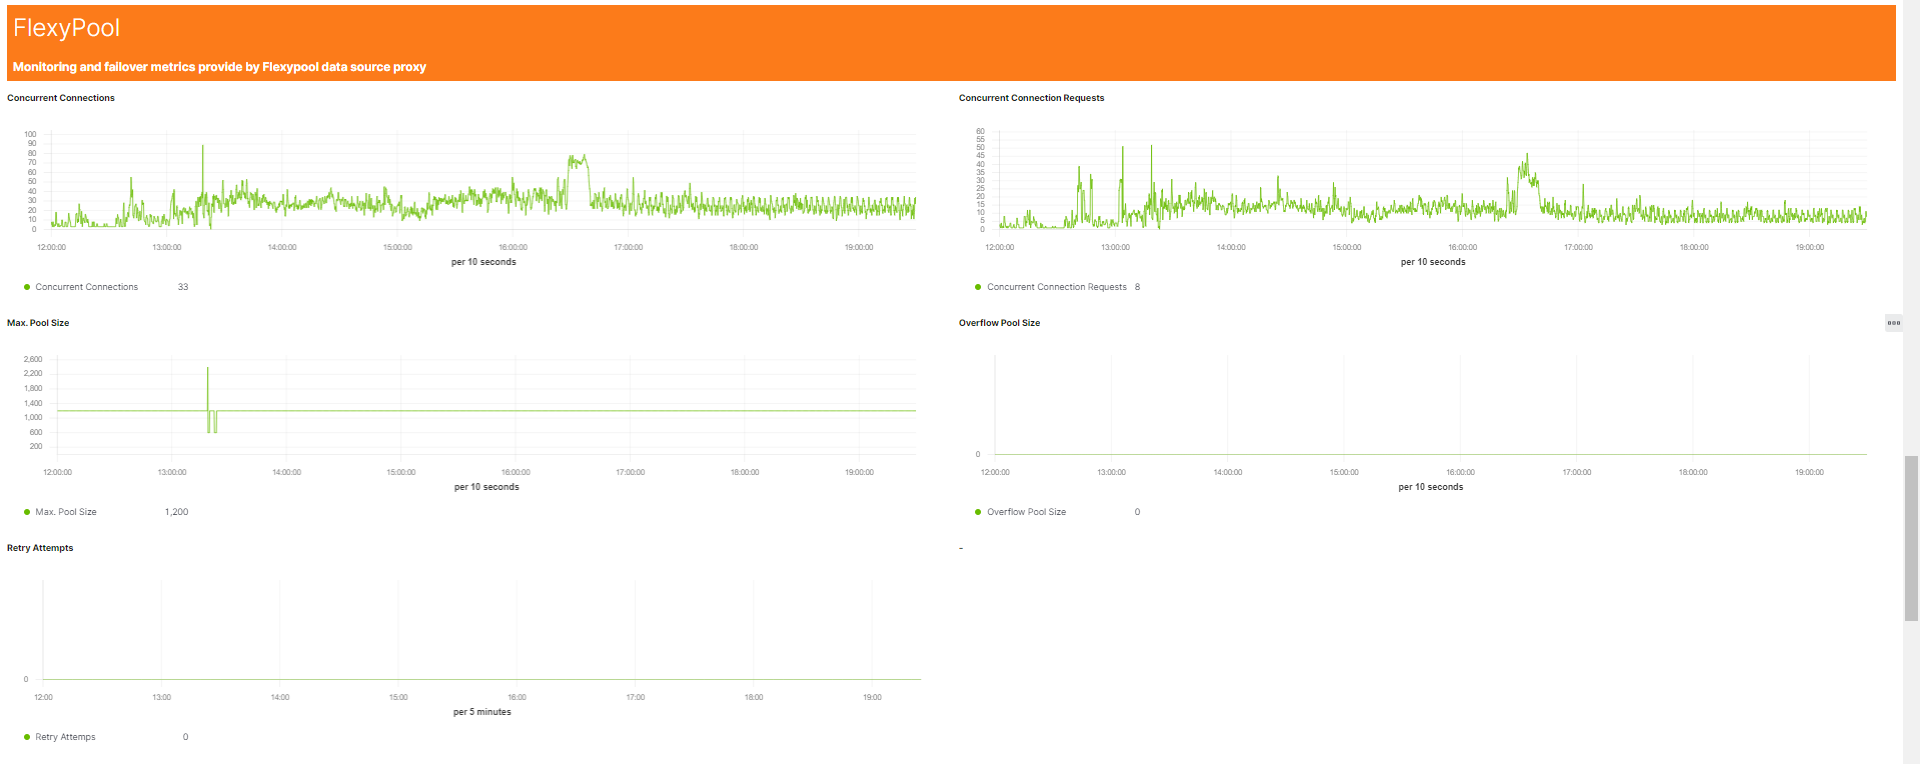
Database FlexyPool Statistics
Monitoring and failover metrics provide by Flexypool data source proxy.
|
Metric Name |
Metric Key |
Description |
|
Concurrent Connection Request |
concurrentConnectionRequestsHistogram |
The amount of concurrent connections requested by the connection pool |
|
Concurrent Connections |
concurrentConnectionsHistogram |
The amount of concurrent connections used by the connection pool |
|
Max Pool Size |
maxPoolSizeHistogram |
The maximum connection pool size |
|
Overflow Pool Size |
overflowPoolSizeHistogram |
The overflow connection pool size (i.e. how much the maximum pool size has been exceeded) |
|
Retry Attemps |
retryAttemptsHistogram |
The amount of retries required in order to request a connection from the connection pool |
Thread Pool Statistics
Metrics for monitoring concurrent execution performance
![]()
|
Metric Name |
Metric Key |
Description |
|
Executor Active |
executor_active |
The amount of active worker threads in the thread pool |
|
Executor Completed |
executor_completed |
The amount of completed worker tasks of the thread pool |
|
Executor Queued |
executor_queued |
The amount of queued worker tasks of the thread pool |
|
Executor Pool Size |
executor_pool_size |
The thread pool size |
Communication Framework
The Communication Framework is responsible for sending data between application servers and application server and rich clients.
Every communication message shows up in this thread pool, and it is important to watch out for queuing of any kind.
Global Filter : Message Type
The message type filters allows filtering (drill-down) of the communication framework for specific messages (every message in the communication framework has a specific message type).
For example it is possible to show the amount and duration of rich client which request data from the database.
Please note that only the communication framework metrics are message type specific, all other metrics won't show any data while the message type has been selected.
messageType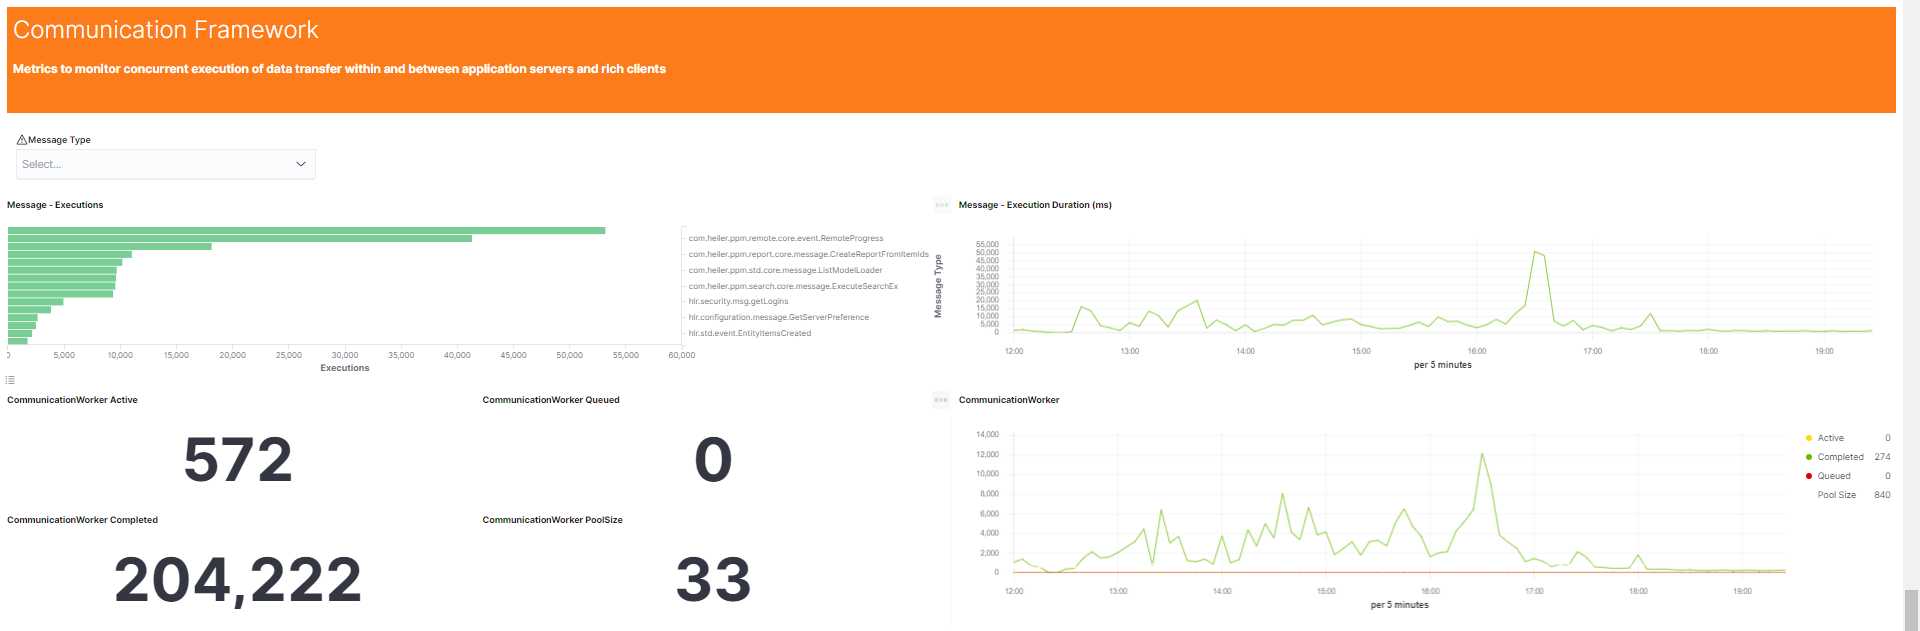
|
Metric Name |
Metric Key |
Description |
|
Message Execution |
communication_message |
The amount of messages executed by the system |
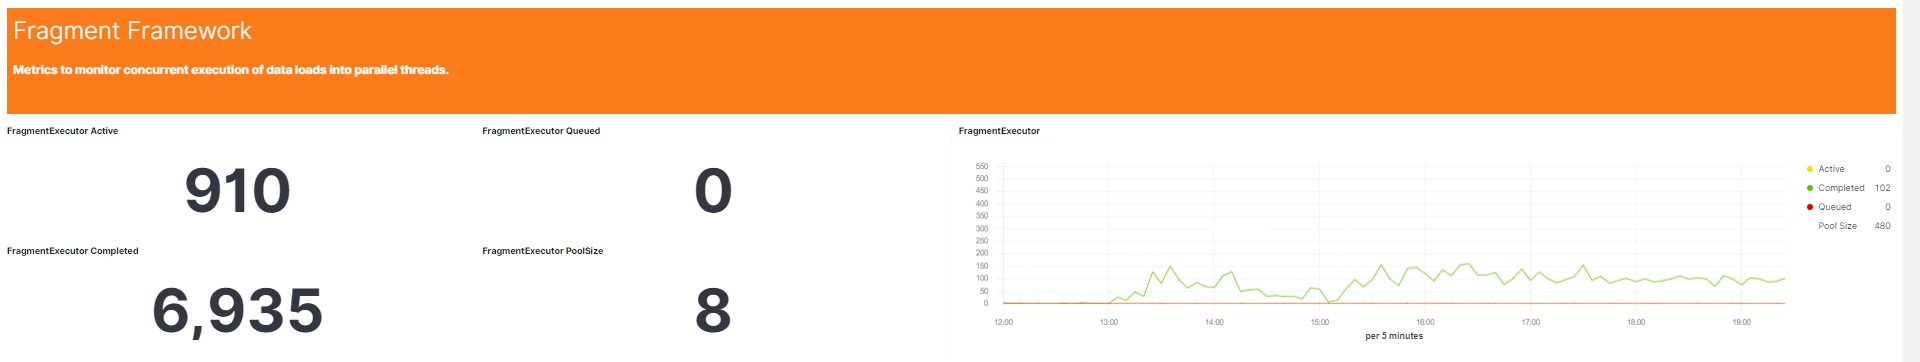
Fragment Framework
The Fragment Manager has a thread pool which supports loading data in parallel threads.
Every parallel loading request of will show up in this thread pool, and it is important to watch out for huge queues.
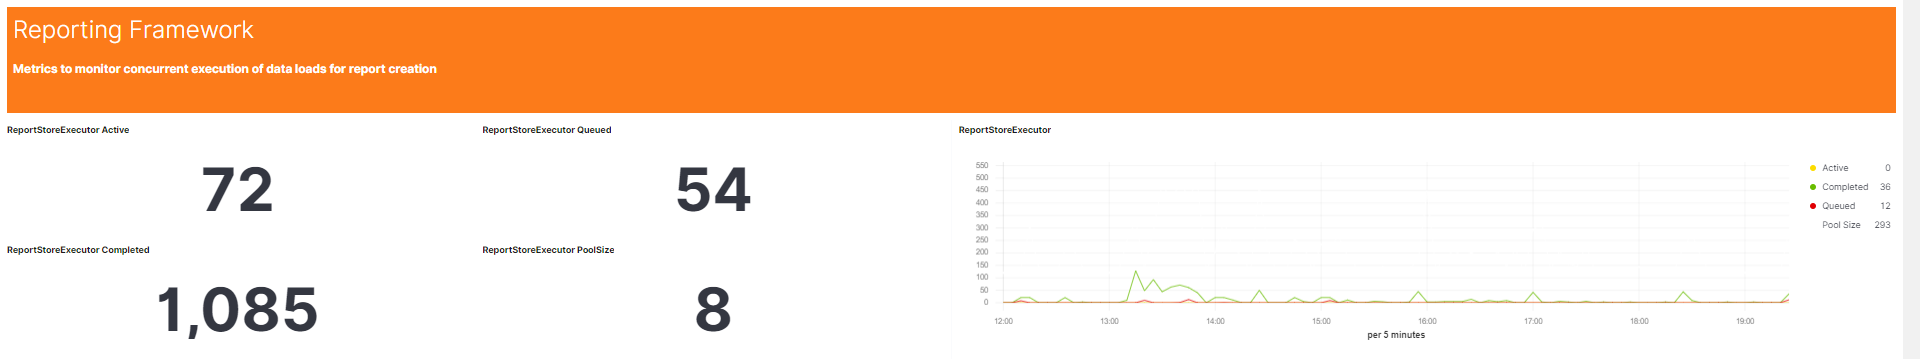
Reporting Framework
The Reporting Framework needs to create reports (i.e. list of object ids) in order to load any kind of data.
When these reports exceed a specific size they will be created in parallel threads, and it is important to watch out for huge queues.
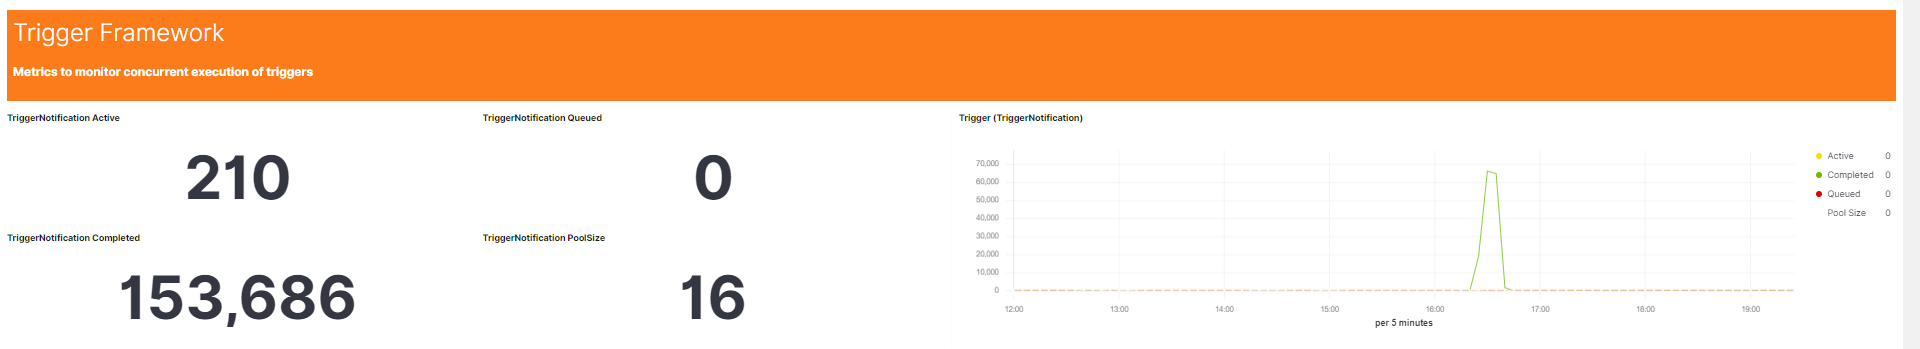
Trigger Framework
Metrics to monitor concurrent execution of triggers.
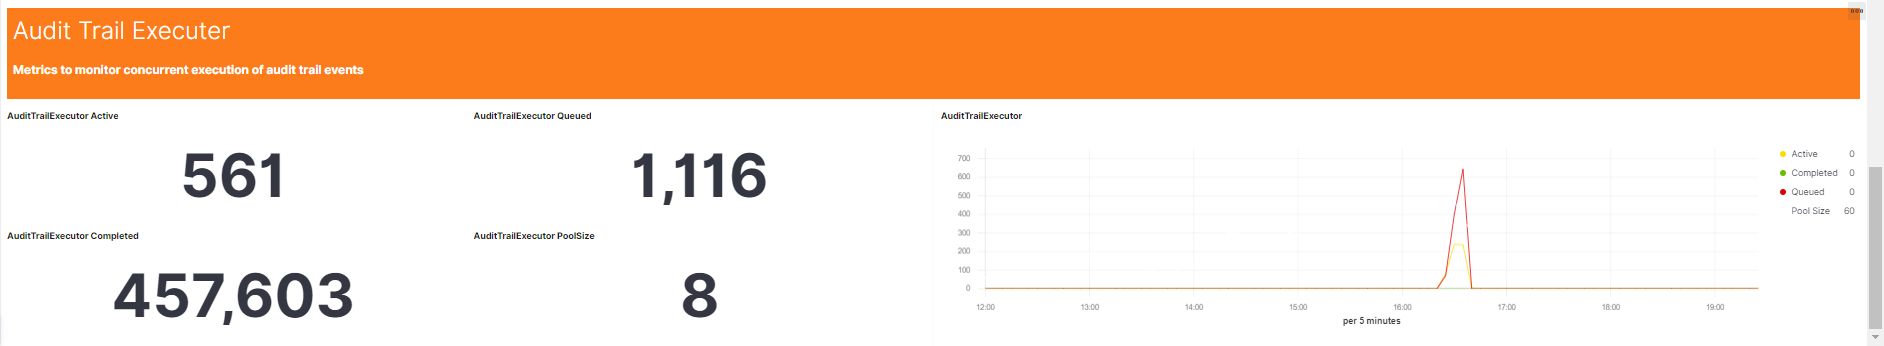
Audit Trail Executer
Every create, change or delete event in the application causes creation of an audit trail summary which will be consumed by triggers, workflows and audit trial.
Every audit trail event will show up in this thread pool, and it is important to watch out for huge queues.